US500 Technical Analysis: 🎯 At Critical Juncture - 6,500 Breakout or Major Rejection? ⚖️
Asset: US500 (S&P 500 CFD)
Analysis Date: September 5, 2025
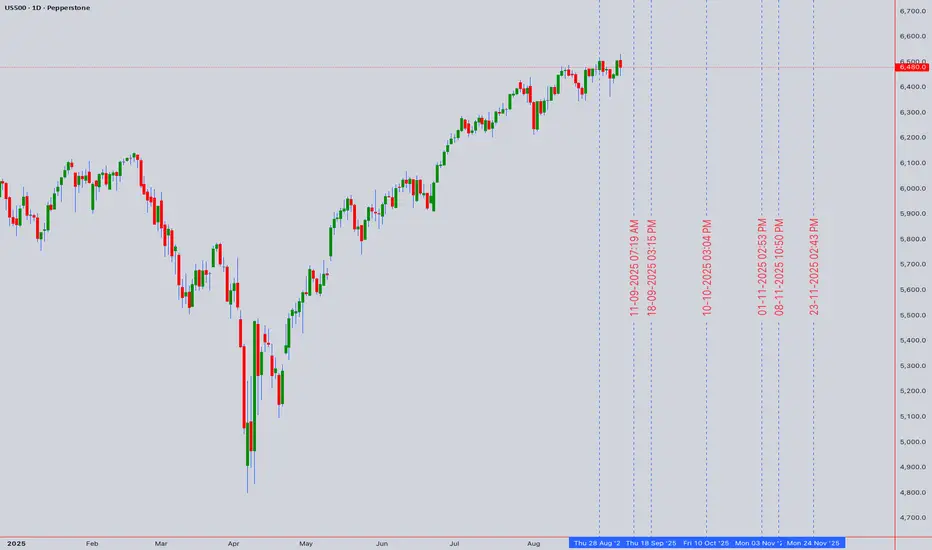
Current Closing Price: 6,480.0 (as of 12:59 AM UTC+4)
Timeframes Analyzed: 1H, 4H, D, W
Executive Summary & Market Outlook 🧐
The US500 is knocking on the door of a historic milestone, trading within striking distance of the 6,500 level. 🚪 This represents a massive psychological and technical barrier. The index is in a strong bullish trend but is displaying classic signs of short-term exhaustion and overextension. The price action here is critical: a decisive breakout could unleash a new wave of buying towards 6,600+, while a rejection could trigger the most significant pullback in weeks. This analysis provides a clear roadmap for intraday traders 🎯 and swing traders 📈 navigating this pivotal moment.
Multi-Timeframe Technical Analysis 🔍
1. Trend Analysis (Daily & 4-Hour Chart):
2. Key Chart Patterns & Theories:
3. Critical Support & Resistance Levels:
4. Indicator Consensus:
Trading Strategy & Forecast 🎯
A. Intraday Trading Strategy (5M - 1H Charts):
Bearish Scenario (Rejection Play) ⬇️: Given overbought conditions, this is a high-probability setup. Watch for bearish reversal candlestick patterns (e.g., Bearish Engulfing, Evening Star 🌟, Doji) at or near the 6,500 resistance.
Bullish Scenario (Breakout Play) ⬆️: If buyers break through with force, wait for a pullback to the breakout level for a better entry.
B. Swing Trading Strategy (4H - D Charts):
Strategy: PATIENCE IS KEY. The risk/reward for new long entries at this resistance is poor. 🚫
Ideal Long Zones: A pullback to 6,320 would be an optimal entry to add long positions for the next leg up in the primary bull trend. A shallower pullback to 6,400 could also offer an opportunity. ✅
Bearish Risk: A daily close below 6,300 would signal a deeper correction is underway, potentially targeting the 6,200 support zone.
Risk Management & Conclusion ⚠️
Key Risk Events: High-impact US data (CPI, PPI, NFP) and Fed commentary are paramount. 🔥 The market is highly sensitive to any hint of a shift in monetary policy.
Geopolitical events can also trigger flight-to-safety flows.
Position Sizing: Due to the potential for explosive volatility at this key level, conservative position sizing is non-negotiable. Risk no more than 1% of capital per trade.
Conclusion: The US500 is at a critical inflection point. ⚖️ The bullish trend is intact, but price is exhausted. This is a low-risk-taking zone. Swing traders should be patient for a better entry. Intraday traders can play the range between 6,400 and 6,500 until a decisive break occurs. The most probable outcome is a pullback to recharge before the next major directional move. 📊
Overall Bias: 🟢 Bullish above 6,320 | 🟡 Neutral/Bearish between 6,480-6,500
Asset: US500 (S&P 500 CFD)
Analysis Date: September 5, 2025
Current Closing Price: 6,480.0 (as of 12:59 AM UTC+4)
Timeframes Analyzed: 1H, 4H, D, W
Executive Summary & Market Outlook 🧐
The US500 is knocking on the door of a historic milestone, trading within striking distance of the 6,500 level. 🚪 This represents a massive psychological and technical barrier. The index is in a strong bullish trend but is displaying classic signs of short-term exhaustion and overextension. The price action here is critical: a decisive breakout could unleash a new wave of buying towards 6,600+, while a rejection could trigger the most significant pullback in weeks. This analysis provides a clear roadmap for intraday traders 🎯 and swing traders 📈 navigating this pivotal moment.
Multi-Timeframe Technical Analysis 🔍
1. Trend Analysis (Daily & 4-Hour Chart):
- Primary Trend: 🟢 Bullish. Price is well above all major Daily Moving Averages, which are sloping upwards in bullish alignment.
- Short-Term Trend: 🟡 Bullish but Fragile. The rally has been relentless, leaving the price extended and vulnerable to a sharp, news-driven correction.
2. Key Chart Patterns & Theories:
- Ascending Wedge / Bull Flag? 🤔: The recent consolidation near the highs could be interpreted as a small bull flag (pausing before breakout) or the end of an ascending wedge (bearish reversal). The next major candle will likely resolve this.
- Elliott Wave Theory 🌊: The rally from the last major low is a clear five-wave impulse. We are likely in the final stages of Wave 5. This suggests the completion of a cycle and warns that a larger corrective phase (Wave 4 or A-B-C) is the next probable move. A typical retracement target is the 38.2% Fibonacci level of the entire Wave 3 move.
- Ichimoku Cloud (H4/D1) ☁️: Price is trading far above the Cloud on daily charts, confirming the strong bullish trend. However, this also signals a significant over-extension from mean support, increasing mean reversion risk.
- Gann Theory ⏳: The 6,500 level is a key psychological and mathematical resistance. A decisive break and close above it could open the path to the next Gann angle target.
3. Critical Support & Resistance Levels:
- Resistance (R1): 6,500 - 6,520 (Key Psychological & Technical Ceiling) 🚨
- Resistance (R2): 6,600 (Projected Target)
- Current Closing Price: ~6,480
- Support (S1): 6,400 - 6,420 (Immediate Support & Prior Breakout Zone) ✅
- Support (S2): 6,300 - 6,320 (Major Support - 38.2% Fib & 21-day EMA) 🛡️
- Support (S3): 6,200 (50-day EMA & 50% Fib Retracement)
4. Indicator Consensus:
- RSI (14-period on 4H/D): Reading is between 68 and 72, signaling overbought conditions. 📛 This warns of weakening momentum and increased downside vulnerability. A bearish divergence on the 4H chart would be a strong short-term sell signal.
- Bollinger Bands (4H) 📏: Price is hugging the upper band, a sign of strong momentum. A move back to the middle band (~6,400) would be a healthy and expected development.
- Moving Averages: The bullish alignment (EMA8 > EMA21 > EMA50) is perfect. The EMA 21 on the 4H chart acts as dynamic support and is a key level for the bullish thesis.
- Volume & VWAP: Volume has been inconsistent on the most recent push higher, a potential bearish divergence 📉 suggesting a lack of strong conviction from large players at these exact levels.
Trading Strategy & Forecast 🎯
A. Intraday Trading Strategy (5M - 1H Charts):
Bearish Scenario (Rejection Play) ⬇️: Given overbought conditions, this is a high-probability setup. Watch for bearish reversal candlestick patterns (e.g., Bearish Engulfing, Evening Star 🌟, Doji) at or near the 6,500 resistance.
- Entry: On confirmation of rejection (e.g., a break below a 1H support low).
- Stop Loss: Tight, above 6,520.
- Target: 6,420 (TP1), 6,400 (TP2).
Bullish Scenario (Breakout Play) ⬆️: If buyers break through with force, wait for a pullback to the breakout level for a better entry.
- Entry: On a re-test of 6,500 as new support.
- Stop Loss: Below 6,480.
- Target: 6,550 (TP1), 6,600 (TP2).
B. Swing Trading Strategy (4H - D Charts):
Strategy: PATIENCE IS KEY. The risk/reward for new long entries at this resistance is poor. 🚫
Ideal Long Zones: A pullback to 6,320 would be an optimal entry to add long positions for the next leg up in the primary bull trend. A shallower pullback to 6,400 could also offer an opportunity. ✅
Bearish Risk: A daily close below 6,300 would signal a deeper correction is underway, potentially targeting the 6,200 support zone.
Risk Management & Conclusion ⚠️
Key Risk Events: High-impact US data (CPI, PPI, NFP) and Fed commentary are paramount. 🔥 The market is highly sensitive to any hint of a shift in monetary policy.
Geopolitical events can also trigger flight-to-safety flows.
Position Sizing: Due to the potential for explosive volatility at this key level, conservative position sizing is non-negotiable. Risk no more than 1% of capital per trade.
Conclusion: The US500 is at a critical inflection point. ⚖️ The bullish trend is intact, but price is exhausted. This is a low-risk-taking zone. Swing traders should be patient for a better entry. Intraday traders can play the range between 6,400 and 6,500 until a decisive break occurs. The most probable outcome is a pullback to recharge before the next major directional move. 📊
Overall Bias: 🟢 Bullish above 6,320 | 🟡 Neutral/Bearish between 6,480-6,500
Note
For individuals seeking to enhance their trading abilities based on the analyses provided, I recommend exploring the mentoring program offered by Shunya Trade. (Website: shunya dot trade)I would appreciate your feedback on this analysis, as it will serve as a valuable resource for future endeavors.
Sincerely,
Shunya.Trade
Website: shunya dot trade
⚠️Disclaimer: This post is intended solely for educational purposes and does not constitute investment advice, financial advice, or trading recommendations. The views expressed herein are derived from technical analysis and are shared for informational purposes only. The stock market inherently carries risks, including the potential for capital loss. Therefore, readers are strongly advised to exercise prudent judgment before making any investment decisions. We assume no liability for any actions taken based on this content. For personalized guidance, it is recommended to consult a certified financial advisor.
I am nothing
Disclaimer
The information and publications are not meant to be, and do not constitute, financial, investment, trading, or other types of advice or recommendations supplied or endorsed by TradingView. Read more in the Terms of Use.
I am nothing
Disclaimer
The information and publications are not meant to be, and do not constitute, financial, investment, trading, or other types of advice or recommendations supplied or endorsed by TradingView. Read more in the Terms of Use.