I know that the chart looks a bit messy, but its about results at the end of the day.
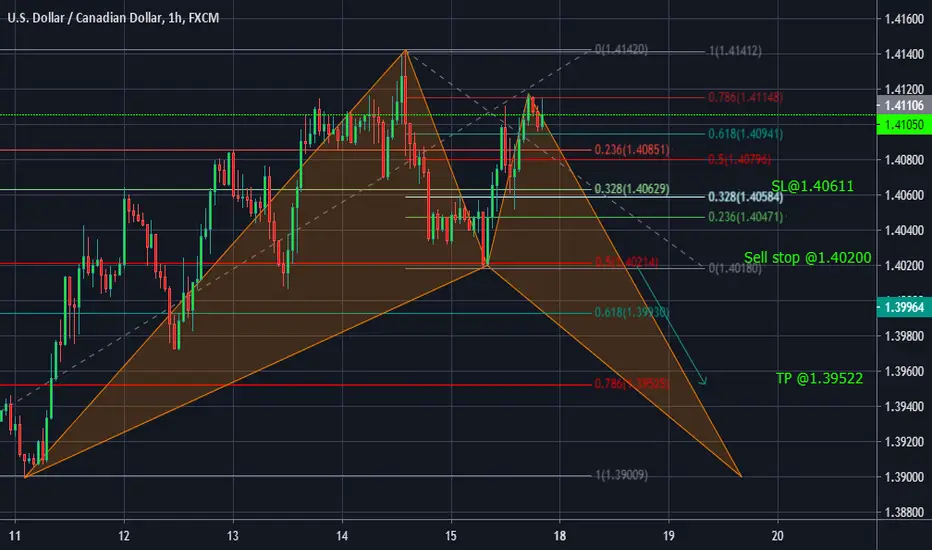
For my analysis on USDCAD I used the Bat Pattern, Point B is currently resting at 50% of my XA Fib zone, with C at 78.6% of AB Fib zone. I am waiting for the market to move back down to the B level where it will trigger my sell stop. but if C moves beyond the 78.6% and breaks my high(which is A in this case) I will focus on something else. Its a holiday tomorrow in Canada markets might favor the dollar. but hey we will see.
Remember: everyone has a different view.
Disclaimer
The information and publications are not meant to be, and do not constitute, financial, investment, trading, or other types of advice or recommendations supplied or endorsed by TradingView. Read more in the Terms of Use.
Disclaimer
The information and publications are not meant to be, and do not constitute, financial, investment, trading, or other types of advice or recommendations supplied or endorsed by TradingView. Read more in the Terms of Use.