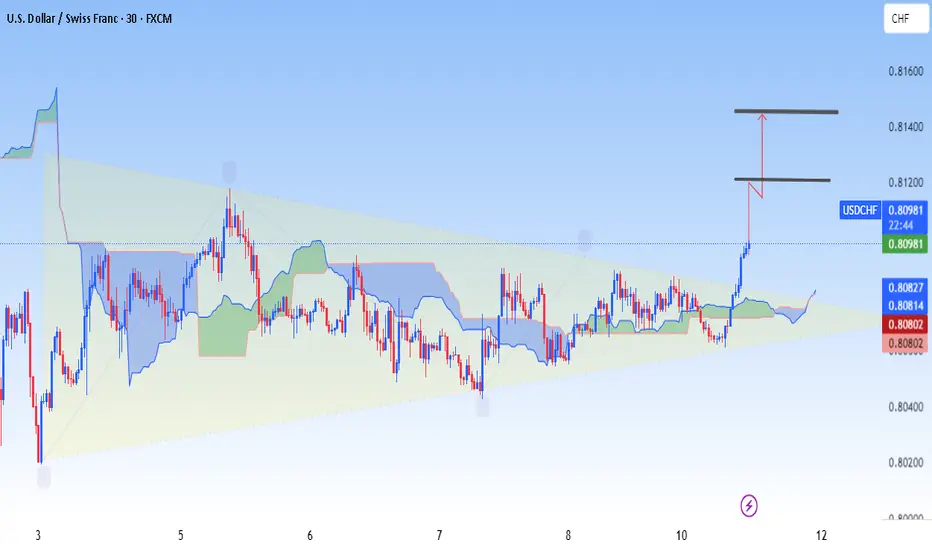
price action of USD/CHF is forming a symmetrical triangle pattern. This is visible with the converging trendlines, where both highs and lows are getting tighter over time.
The purple zone represents a resistance area — if the breakout occurs upward (as your drawing suggests), it would confirm a bullish breakout from the triangle.
Target Calculation (based on the chart markings):
Breakout zone: ~0.8095
Target point shown: ~0.8152 to 0.8144
That matches your “target point” label on the chart, suggesting a projected move of about 55–65 pips from the breakout.
Summary:
Pattern: Symmetrical Triangle (Bullish Breakout Expected)
Target: ~0.8152 – 0.8144
Trade closed: stop reached
✅JOIN FREE TELEGRAM
✅t.me/+atTT3a4htZ8yZjQ0
✅DAILY 3-4 SIGNALS
✅ALL PAIRS CRYPTO & GOLD
✅t.me/+atTT3a4htZ8yZjQ0
✅DAILY 3-4 SIGNALS
✅ALL PAIRS CRYPTO & GOLD
Disclaimer
The information and publications are not meant to be, and do not constitute, financial, investment, trading, or other types of advice or recommendations supplied or endorsed by TradingView. Read more in the Terms of Use.