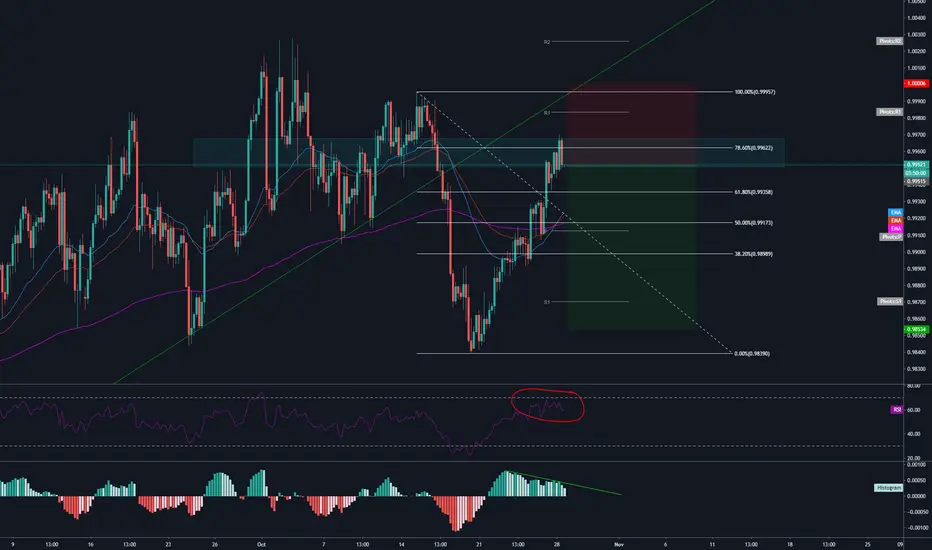
I am seeing a short here:
1. Price has pulled back up to the 78.6% Fib level, but the 61.8% level if observed from a daily.
2. MACD divergence
3. Price has broken out of the main uptrend channel from last week.
4. We have a candle closing on the 4 hour to suggest a price reversal. I would call this a Harami being forced to be technical. Ideally a "Tweezer or engulfing"
5. RSI not quite there but close to "overbought"
That's it, I am going to take this trade, 1% Risk 2:1RR - Happy Trading!
Note
correction: not a Harami, as no really candle pattern is perfectly defined I would lean toward a "Tweezer Top", I try and use the original technical analysis terms founded by Japanese rice traders in the 16th century, paying homage to the craft.Note
What a wild ride today was.Trade closed: target reached
Disclaimer
The information and publications are not meant to be, and do not constitute, financial, investment, trading, or other types of advice or recommendations supplied or endorsed by TradingView. Read more in the Terms of Use.
Disclaimer
The information and publications are not meant to be, and do not constitute, financial, investment, trading, or other types of advice or recommendations supplied or endorsed by TradingView. Read more in the Terms of Use.