🧭 USD/JPY – 3H Chart Analysis (as of July 14, 2025)
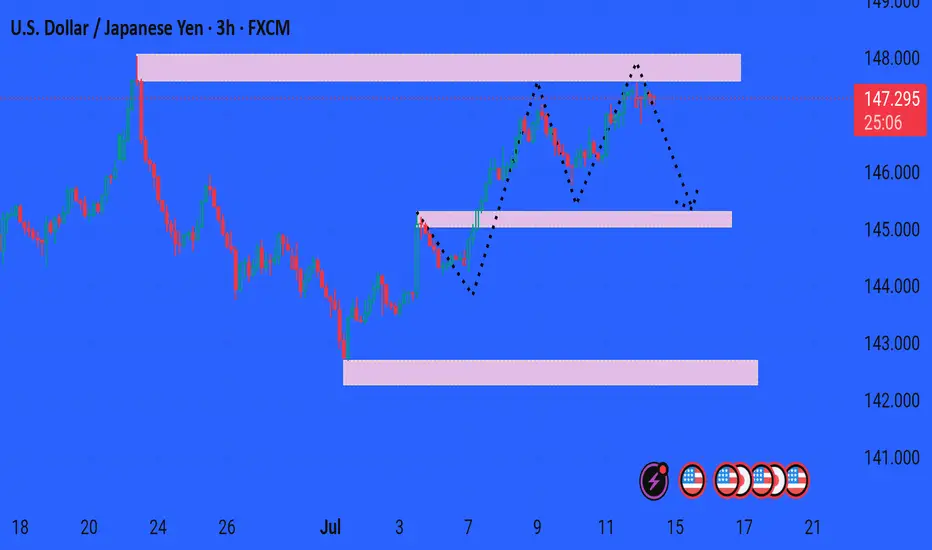
Current Price: 147.315
Trend Bias: Short-term bearish correction
---
🔍 Key Highlights:
🔴 Resistance Zone (~147.8–148.0):
Price rejected from this area twice, forming a potential double top pattern.
🟡 Bearish Path (dotted line):
Suggests a pullback toward:
Support 1: ~146.0 zone
Possibly deeper toward:
Support 2: ~143.0–143.5
📅 Event Risk:
Multiple U.S. economic events (marked below) between July 15–19 could trigger volatility and direction shifts.
---
📌 Summary:
USD/JPY is showing bearish signs from strong resistance, likely heading toward the 146.0 support level. Monitor price action around key zones and U.S. data releases for confirmation.
Would you like a full trade setup (entry, stop, targets)?
t.me/+EQ88IkMSUvQwMGJk
Join telegram channel free
t.me/+EQ88IkMSUvQwMGJk
Join telegram channel free
t.me/+EQ88IkMSUvQwMGJk
Disclaimer
The information and publications are not meant to be, and do not constitute, financial, investment, trading, or other types of advice or recommendations supplied or endorsed by TradingView. Read more in the Terms of Use.
t.me/+EQ88IkMSUvQwMGJk
Join telegram channel free
t.me/+EQ88IkMSUvQwMGJk
Join telegram channel free
t.me/+EQ88IkMSUvQwMGJk
Disclaimer
The information and publications are not meant to be, and do not constitute, financial, investment, trading, or other types of advice or recommendations supplied or endorsed by TradingView. Read more in the Terms of Use.