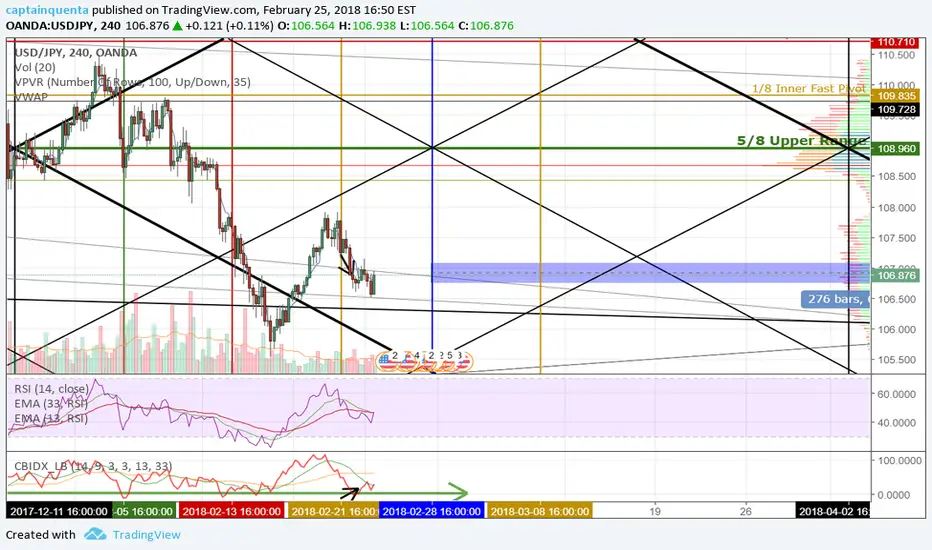
1. Approaching pivot in time (blue horizontal line). Signals a bullish move based on most recent price action.
2. RSI and CI showing strong reversal patterns, divergence in the CI.
3. Gann angle in Square of 144 has been acting as support.
4. Evidence of an early response to the new moon cycle.
2. RSI and CI showing strong reversal patterns, divergence in the CI.
3. Gann angle in Square of 144 has been acting as support.
4. Evidence of an early response to the new moon cycle.
Related publications
Disclaimer
The information and publications are not meant to be, and do not constitute, financial, investment, trading, or other types of advice or recommendations supplied or endorsed by TradingView. Read more in the Terms of Use.
Related publications
Disclaimer
The information and publications are not meant to be, and do not constitute, financial, investment, trading, or other types of advice or recommendations supplied or endorsed by TradingView. Read more in the Terms of Use.