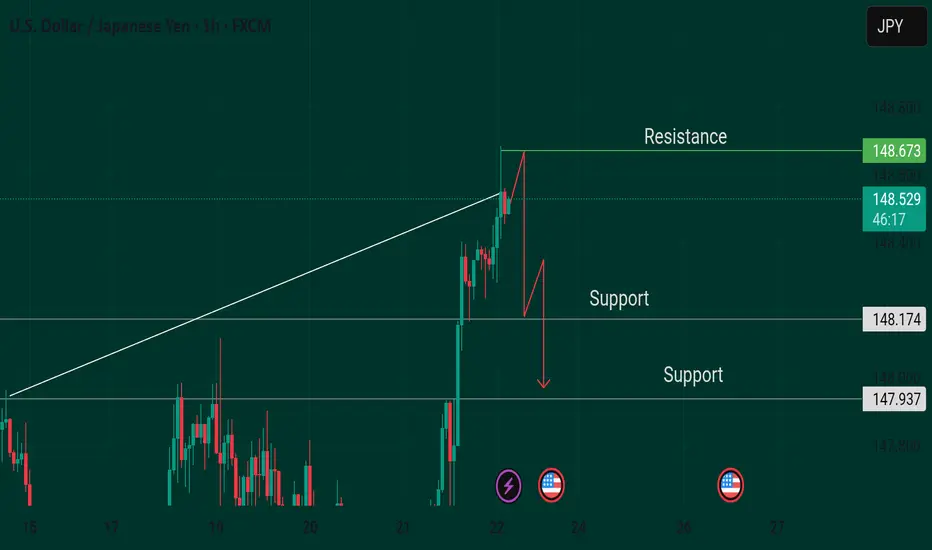
USD/JPY has been trading sideways in a range between 146.22 and 148.52 from almost three weeks. The pair trades close to the 20-day Exponential Moving Average (EMA) around 147.56, indicating a sideways trend.
The 14-day Relative Strength Index (RSI) oscillates inside the 40.00-60.00 range, suggesting indecisiveness among market participants.
The pair would see more upside to near the psychological level of 150.00 and the March 28 high of 151.20 if it breaks above the July 16 high of 149.19.
On the flip side, a reversal move by the pair below the July 24 low of 145.85 would pave the way for the July 7 low at 144.22, followed by the July 3 low of 143.45.
Disclaimer
The information and publications are not meant to be, and do not constitute, financial, investment, trading, or other types of advice or recommendations supplied or endorsed by TradingView. Read more in the Terms of Use.
Disclaimer
The information and publications are not meant to be, and do not constitute, financial, investment, trading, or other types of advice or recommendations supplied or endorsed by TradingView. Read more in the Terms of Use.
