analyzing USD/JPY on the 3H chart.
Looking at my chart:
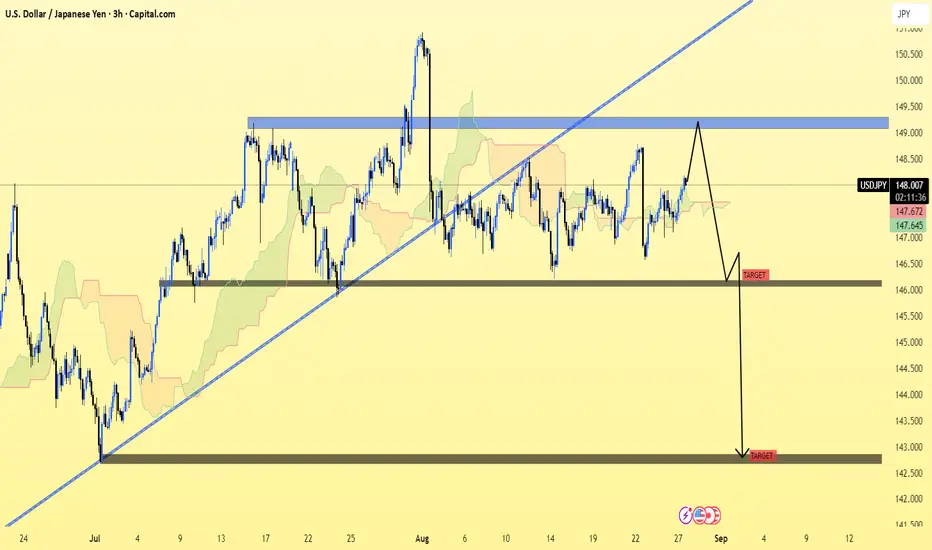
Price is trading around 148.05.
There’s a blue resistance zone near 149.00–149.50 (supply area).
You have drawn two downside targets after potential rejection.
📉 Key Bearish Targets (from your chart)
1. First Target Zone: Around 146.50
→ This is the first strong support area marked.
2. Second / Final Target Zone: Around 142.00–142.20
→ If bearish continuation plays out, this is the larger downside target.
⚠ Trade Notes
A rejection from 149.00 resistance could trigger a fall toward 146.50.
A break below 146.50 support would strengthen bearish momentum, opening the way to 142.00.
On the other hand, if price breaks and holds above 149.50, this bearish scenario is invalidated.
👉 In summary: Target 1 = 146.50, Target 2 = 142.00.
Looking at my chart:
Price is trading around 148.05.
There’s a blue resistance zone near 149.00–149.50 (supply area).
You have drawn two downside targets after potential rejection.
📉 Key Bearish Targets (from your chart)
1. First Target Zone: Around 146.50
→ This is the first strong support area marked.
2. Second / Final Target Zone: Around 142.00–142.20
→ If bearish continuation plays out, this is the larger downside target.
⚠ Trade Notes
A rejection from 149.00 resistance could trigger a fall toward 146.50.
A break below 146.50 support would strengthen bearish momentum, opening the way to 142.00.
On the other hand, if price breaks and holds above 149.50, this bearish scenario is invalidated.
👉 In summary: Target 1 = 146.50, Target 2 = 142.00.
Trade active
trade active📲 Join telegram channel free ..
t.me/EU_USA_AND_CHAINA_TRADER
Forex, Gold & Crypto Signals with detailed analysis & get consistent results..
Gold Signal's with proper TP & SL for high profit ..
t.me/+GnRTz3YWKk9mZDM8
t.me/EU_USA_AND_CHAINA_TRADER
Forex, Gold & Crypto Signals with detailed analysis & get consistent results..
Gold Signal's with proper TP & SL for high profit ..
t.me/+GnRTz3YWKk9mZDM8
Related publications
Disclaimer
The information and publications are not meant to be, and do not constitute, financial, investment, trading, or other types of advice or recommendations supplied or endorsed by TradingView. Read more in the Terms of Use.
📲 Join telegram channel free ..
t.me/EU_USA_AND_CHAINA_TRADER
Forex, Gold & Crypto Signals with detailed analysis & get consistent results..
Gold Signal's with proper TP & SL for high profit ..
t.me/+GnRTz3YWKk9mZDM8
t.me/EU_USA_AND_CHAINA_TRADER
Forex, Gold & Crypto Signals with detailed analysis & get consistent results..
Gold Signal's with proper TP & SL for high profit ..
t.me/+GnRTz3YWKk9mZDM8
Related publications
Disclaimer
The information and publications are not meant to be, and do not constitute, financial, investment, trading, or other types of advice or recommendations supplied or endorsed by TradingView. Read more in the Terms of Use.