SMC Trading point update
Technical analysis of USD/JPY on the 4-hour timeframe, using a combination of trendline support, key horizontal levels, and EMA 200 confluence to identify a potential bounce.
---
Technical Breakdown:
1. Market Structure:
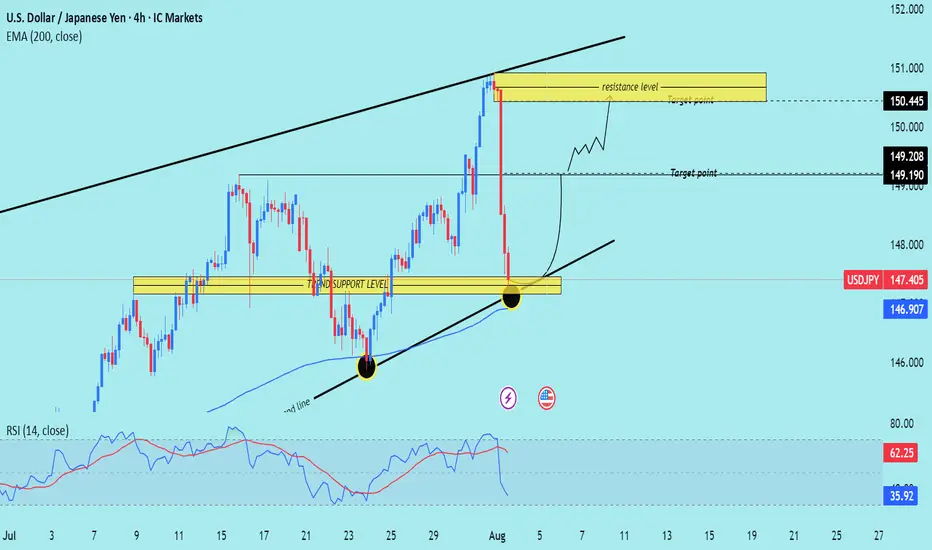
USD/JPY experienced a sharp decline from the resistance zone near 150.445, but price is now testing a strong confluence support area:
Horizontal support zone
Rising trendline
200 EMA (146.907)
2. Support Confluence Zone:
Marked as "trend support level", this zone has historically acted as a springboard for bullish moves.
Recent price action shows a wick rejection at this zone, indicating buying pressure.
3. Resistance/Target Zones:
Target 1: 149.190 – 149.208
Target 2: 150.445 (major resistance zone)
4. EMA 200:
Price is reacting just above the 200 EMA, strengthening the bullish case for a bounce.
5. RSI (14):
RSI has dipped to 35.92, near oversold territory, suggesting the downside may be exhausted.
Prior bounce from similar RSI levels led to strong upward moves.
6. Projected Path:
The chart outlines a potential bullish recovery, targeting a climb back into the upper channel and retesting previous highs.
Mr SMC Trading point
---
Trade Idea Summary:
Bias: Bullish (Reversal from trendline + support zone)
Entry Zone: Current level near 147.40–146.90 (support confluence)
Targets:
TP1: 149.190
TP2: 150.445
Invalidation: Daily close below trendline and 200 EMA (~146.70 or lower)
Indicators: RSI supports a bounce; EMA and trendline confirm structure
Please support boost 🚀 this analysis)
Technical analysis of USD/JPY on the 4-hour timeframe, using a combination of trendline support, key horizontal levels, and EMA 200 confluence to identify a potential bounce.
---
Technical Breakdown:
1. Market Structure:
USD/JPY experienced a sharp decline from the resistance zone near 150.445, but price is now testing a strong confluence support area:
Horizontal support zone
Rising trendline
200 EMA (146.907)
2. Support Confluence Zone:
Marked as "trend support level", this zone has historically acted as a springboard for bullish moves.
Recent price action shows a wick rejection at this zone, indicating buying pressure.
3. Resistance/Target Zones:
Target 1: 149.190 – 149.208
Target 2: 150.445 (major resistance zone)
4. EMA 200:
Price is reacting just above the 200 EMA, strengthening the bullish case for a bounce.
5. RSI (14):
RSI has dipped to 35.92, near oversold territory, suggesting the downside may be exhausted.
Prior bounce from similar RSI levels led to strong upward moves.
6. Projected Path:
The chart outlines a potential bullish recovery, targeting a climb back into the upper channel and retesting previous highs.
Mr SMC Trading point
---
Trade Idea Summary:
Bias: Bullish (Reversal from trendline + support zone)
Entry Zone: Current level near 147.40–146.90 (support confluence)
Targets:
TP1: 149.190
TP2: 150.445
Invalidation: Daily close below trendline and 200 EMA (~146.70 or lower)
Indicators: RSI supports a bounce; EMA and trendline confirm structure
Please support boost 🚀 this analysis)
(Services:✔️ JOIN Telegram channel
t.me/SMCTrading_point
Gold trading signals 🚀 99%
t.me/SMCTrading_point
Join my recommended broker , link 👇
World best broker exness ✅D
one.exnesstrack.org/a/l1t1rf3p6v
t.me/SMCTrading_point
Gold trading signals 🚀 99%
t.me/SMCTrading_point
Join my recommended broker , link 👇
World best broker exness ✅D
one.exnesstrack.org/a/l1t1rf3p6v
Related publications
Disclaimer
The information and publications are not meant to be, and do not constitute, financial, investment, trading, or other types of advice or recommendations supplied or endorsed by TradingView. Read more in the Terms of Use.