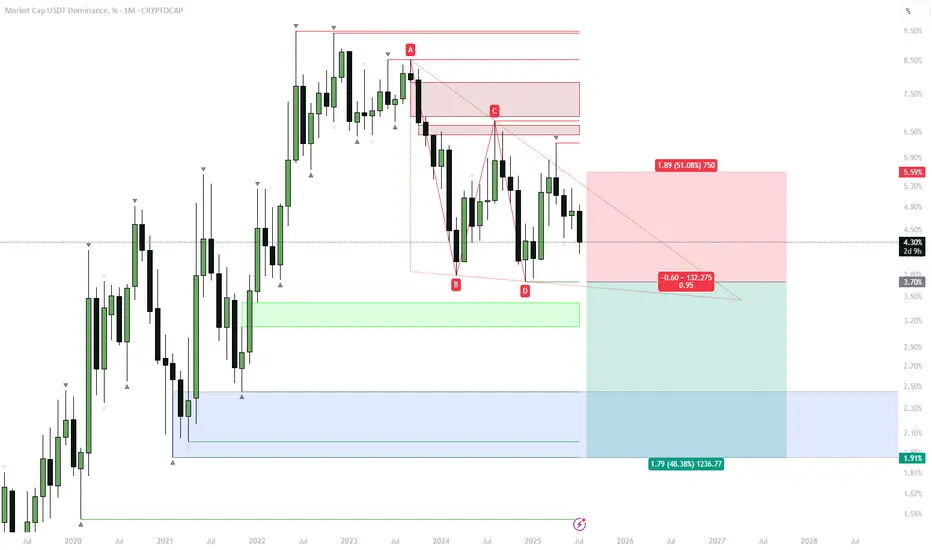
From a monthly perspective,  USDT.D is showing a textbook bearish descending triangle at the top — right after a decade-long uptrend. Price has repeatedly failed to break above resistance, forming a series of lower highs and consistent support.
Scenario:
If the support gives way and this pattern confirms, we could see a multi-year unwind, with the next major target down at 1.9–2.0%.
The first zone to watch for a reaction is around 3.7–3.8%, but the main macro demand sits much lower.
Why this matters:
A breakdown in USDT dominance typically coincides with a massive rotation into risk-on assets and altcoins — the end of a cycle in stablecoins often sparks the next big phase of the crypto bull market.
Plan:
Watch for confirmation of the breakdown on a monthly close below 3.7%.
Until then, this is just a setup — not a trigger.
Related publications
Disclaimer
The information and publications are not meant to be, and do not constitute, financial, investment, trading, or other types of advice or recommendations supplied or endorsed by TradingView. Read more in the Terms of Use.
Related publications
Disclaimer
The information and publications are not meant to be, and do not constitute, financial, investment, trading, or other types of advice or recommendations supplied or endorsed by TradingView. Read more in the Terms of Use.