✅ Key Observations:
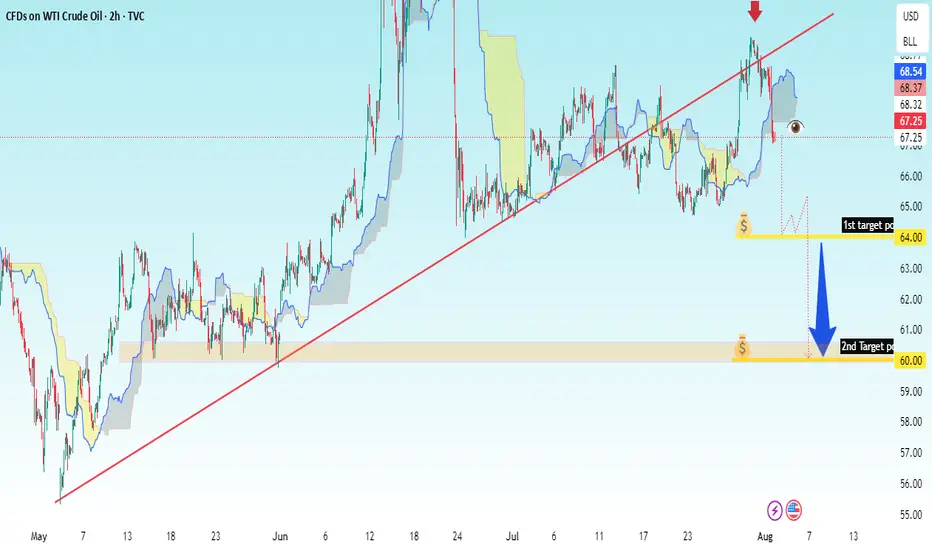
1. Chart Type: Candlestick chart (2h interval).
2. Trend Line: An uptrend line (red) is drawn, now broken to the downside.
3. Ichimoku Cloud: Price has broken below the Ichimoku cloud, signaling potential bearish momentum.
4. Red Arrow: Indicates a potential short entry point where price broke below the trendline.
5. Downside Targets:
1st Target Point: $64.00
2nd Target Point: $60.00
6. Bearish Projection: A large blue arrow pointing downward from the breakdown level implies a strong sell setup.
---
🎯 Your Trade Setup (based on chart):
Entry (Sell): Around $67.25–$67.50
Stop Loss: Above recent high or Ichimoku resistance, approx $68.70
Target 1: $64.00
Target 2: $60.00
Risk-Reward Ratio: Favorable, around 1:2.5 or better depending on entry
t.me/+cKW-ibvnp_lmYTc0
Forex, gold and crypto signal's with detailed analysis & get consistent results..
t.me/+cKW-ibvnp_lmYTc0
Gold signal's with proper TP & SL for high profits opportunities..
Forex, gold and crypto signal's with detailed analysis & get consistent results..
t.me/+cKW-ibvnp_lmYTc0
Gold signal's with proper TP & SL for high profits opportunities..
Disclaimer
The information and publications are not meant to be, and do not constitute, financial, investment, trading, or other types of advice or recommendations supplied or endorsed by TradingView. Read more in the Terms of Use.
t.me/+cKW-ibvnp_lmYTc0
Forex, gold and crypto signal's with detailed analysis & get consistent results..
t.me/+cKW-ibvnp_lmYTc0
Gold signal's with proper TP & SL for high profits opportunities..
Forex, gold and crypto signal's with detailed analysis & get consistent results..
t.me/+cKW-ibvnp_lmYTc0
Gold signal's with proper TP & SL for high profits opportunities..
Disclaimer
The information and publications are not meant to be, and do not constitute, financial, investment, trading, or other types of advice or recommendations supplied or endorsed by TradingView. Read more in the Terms of Use.