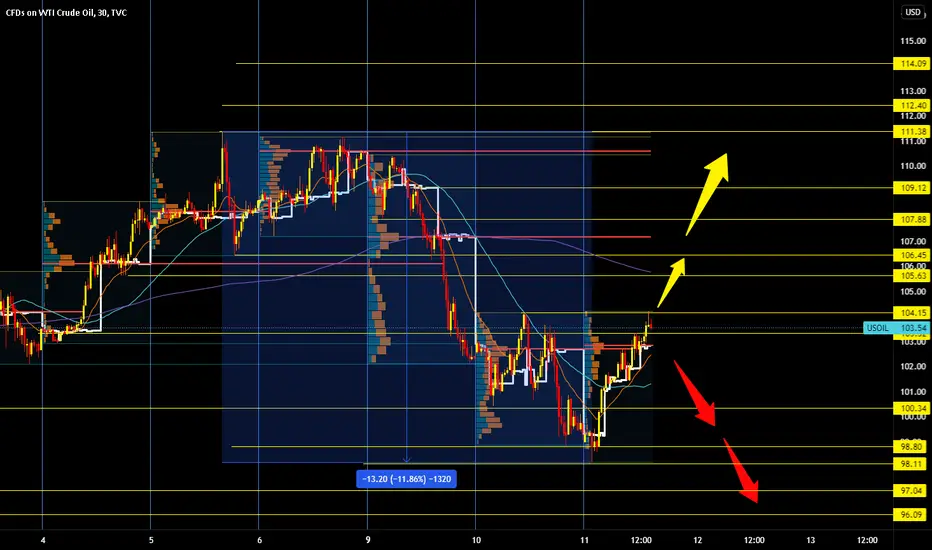
At the beginning of the Asian session, the oil price fell to its lowest level this week to $ 98.11. Positive consolidation soon followed, and the price was again above the $ 100 level. By the middle of the European session, the oil price recovered by 5 dollars, jumping to 103.32 dollars. We now have a smaller withdrawal of up to $ 102.55. the highest volatility on the oil chart was in the $ 101.90-102.10 zone, and here we can look for potential support to continue the bullish trend. Our next target is yesterday's high at $ 104.15. A break above would be a sign that the price has formed a bottom from which it can continue towards the previous resistance zone of $ 110.00-111.00. For the bearish option, we need to withdraw the price to the previous low of $ 98.11. If the price stays in that place longer, maybe then we will see a breakout below. Potential lower support levels are at $ 97.00 and $ 96.00 prices.
Disclaimer
The information and publications are not meant to be, and do not constitute, financial, investment, trading, or other types of advice or recommendations supplied or endorsed by TradingView. Read more in the Terms of Use.
Disclaimer
The information and publications are not meant to be, and do not constitute, financial, investment, trading, or other types of advice or recommendations supplied or endorsed by TradingView. Read more in the Terms of Use.