Gold 3290 support, the last line of defense for bulls
Gold market analysis: With the weakening of safe-haven demand and the hawkish Fed expectations, gold prices fell to a two-week low under pressure
Market review
Spot gold maintained a narrow range of fluctuations on Wednesday, trading around $3322.93/oz. On Tuesday, the price of gold fell significantly by 2%, hitting a two-week low of $3295.38/oz (the lowest since June 9) during the session, and finally closed at $3322.93. This decline was mainly driven by two factors:
Geopolitical risks eased: Iran and Israel reached a ceasefire agreement, weakening the market's safe-haven demand for gold;
Monetary policy expectations adjusted: Fed Chairman Powell released a cautious interest rate cut signal, suppressing gold bull sentiment.
Technical analysis
Daily level: range compression, weak volatility
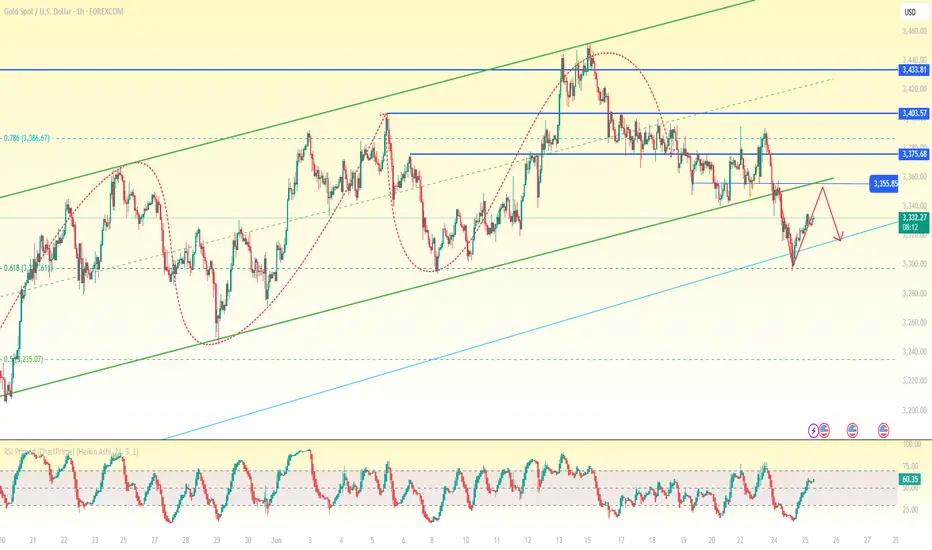
Bollinger Band pattern: three tracks narrowed, showing that the price fluctuation range narrowed to $3290-3420. The current gold price is running between the middle track (3355) and the lower track (3290).
Moving average system: short-term moving averages (such as 5-day and 10-day moving averages) are entangled near the middle track, indicating that the market is in a volatile pattern, but MACD crosses and increases in volume, suggesting that the price center of gravity tends to be weak.
Key support: The 60-day moving average (US$3,290) is an important defense line below. If it is lost, it may further open up the downward space.
4-hour level: oversold rebound, but the upward space is limited
Short-term momentum: three consecutive positive rebounds are formed at low levels, MACD crosses and shrinks in volume, and the fast and slow lines are glued together. The smart indicator (STOCH) quickly repairs upward, indicating that there is a rebound demand for short-term prices.
Resistance level:
First resistance: US$3,342-3,348 (4-hour middle track and Fibonacci 38.2% retracement level);
Strong resistance: US$3,355 (daily middle track) and yesterday's high of US$3,370.
Operation logic: Both the 4-hour and 1-hour charts show bullish signals, but under the suppression of the daily level, the rebound strength may be limited.
Trading strategy
Short-term long:
Entry range: 3322-3324 USD;
Stop loss: 3316 USD (protective stop loss);
Target: 3340-3350 USD (take profits in batches).
Reason: short-term technical indicators are oversold to repair demand, and there is psychological support near 3320.
Short on rallies:
Entry range: 3348-3352 USD;
Stop loss: 3359 USD (invalid if breaking through the middle track of the daily line);
Target: 3330-3320 USD.
Reason: The suppression of the middle track of the daily line combined with the hawkish expectations of the Federal Reserve may reappear after the rebound.
Risk warning
Upside risk: If the geopolitical situation heats up again or the US economic data is weak, the gold price may break through 3355 USD and rebound to 3400.
Downside risk: If the 60-day moving average (3290) is effectively broken, it may trigger technical selling and test the 3250-3230 support area.
(The above analysis is based on the current market environment. Investors need to adjust their strategies based on real-time data)
Gold market analysis: With the weakening of safe-haven demand and the hawkish Fed expectations, gold prices fell to a two-week low under pressure
Market review
Spot gold maintained a narrow range of fluctuations on Wednesday, trading around $3322.93/oz. On Tuesday, the price of gold fell significantly by 2%, hitting a two-week low of $3295.38/oz (the lowest since June 9) during the session, and finally closed at $3322.93. This decline was mainly driven by two factors:
Geopolitical risks eased: Iran and Israel reached a ceasefire agreement, weakening the market's safe-haven demand for gold;
Monetary policy expectations adjusted: Fed Chairman Powell released a cautious interest rate cut signal, suppressing gold bull sentiment.
Technical analysis
Daily level: range compression, weak volatility
Bollinger Band pattern: three tracks narrowed, showing that the price fluctuation range narrowed to $3290-3420. The current gold price is running between the middle track (3355) and the lower track (3290).
Moving average system: short-term moving averages (such as 5-day and 10-day moving averages) are entangled near the middle track, indicating that the market is in a volatile pattern, but MACD crosses and increases in volume, suggesting that the price center of gravity tends to be weak.
Key support: The 60-day moving average (US$3,290) is an important defense line below. If it is lost, it may further open up the downward space.
4-hour level: oversold rebound, but the upward space is limited
Short-term momentum: three consecutive positive rebounds are formed at low levels, MACD crosses and shrinks in volume, and the fast and slow lines are glued together. The smart indicator (STOCH) quickly repairs upward, indicating that there is a rebound demand for short-term prices.
Resistance level:
First resistance: US$3,342-3,348 (4-hour middle track and Fibonacci 38.2% retracement level);
Strong resistance: US$3,355 (daily middle track) and yesterday's high of US$3,370.
Operation logic: Both the 4-hour and 1-hour charts show bullish signals, but under the suppression of the daily level, the rebound strength may be limited.
Trading strategy
Short-term long:
Entry range: 3322-3324 USD;
Stop loss: 3316 USD (protective stop loss);
Target: 3340-3350 USD (take profits in batches).
Reason: short-term technical indicators are oversold to repair demand, and there is psychological support near 3320.
Short on rallies:
Entry range: 3348-3352 USD;
Stop loss: 3359 USD (invalid if breaking through the middle track of the daily line);
Target: 3330-3320 USD.
Reason: The suppression of the middle track of the daily line combined with the hawkish expectations of the Federal Reserve may reappear after the rebound.
Risk warning
Upside risk: If the geopolitical situation heats up again or the US economic data is weak, the gold price may break through 3355 USD and rebound to 3400.
Downside risk: If the 60-day moving average (3290) is effectively broken, it may trigger technical selling and test the 3250-3230 support area.
(The above analysis is based on the current market environment. Investors need to adjust their strategies based on real-time data)
Trade active
Gold fluctuates and tends to be bearish, pay attention to the breakthrough of key positions
Trend structure:
Daily line: It fluctuates and falls from the high point of 3452, 3400 becomes the key resistance, and accelerates downward after breaking 3340.
Short-term: 3340 turns into pressure, 3295/3293 is the key support, and it will fall to 3270 if it falls below.
Operation strategy:
Short order: Try short with a light position near 3340, stop loss above 3350, target 3310-3295.
Break short: After breaking 3293, rebound and follow short, target 3270.
Long order: 3270 touches short long for the first time, stop loss below 3260.
Key risks:
If it stands firm at 3340, it may rebound to test 3360-3380, and the strategy needs to be adjusted.
Pay attention to the fluctuation of evening data.
Disclaimer
The information and publications are not meant to be, and do not constitute, financial, investment, trading, or other types of advice or recommendations supplied or endorsed by TradingView. Read more in the Terms of Use.
Disclaimer
The information and publications are not meant to be, and do not constitute, financial, investment, trading, or other types of advice or recommendations supplied or endorsed by TradingView. Read more in the Terms of Use.