🔍 Chart Overview
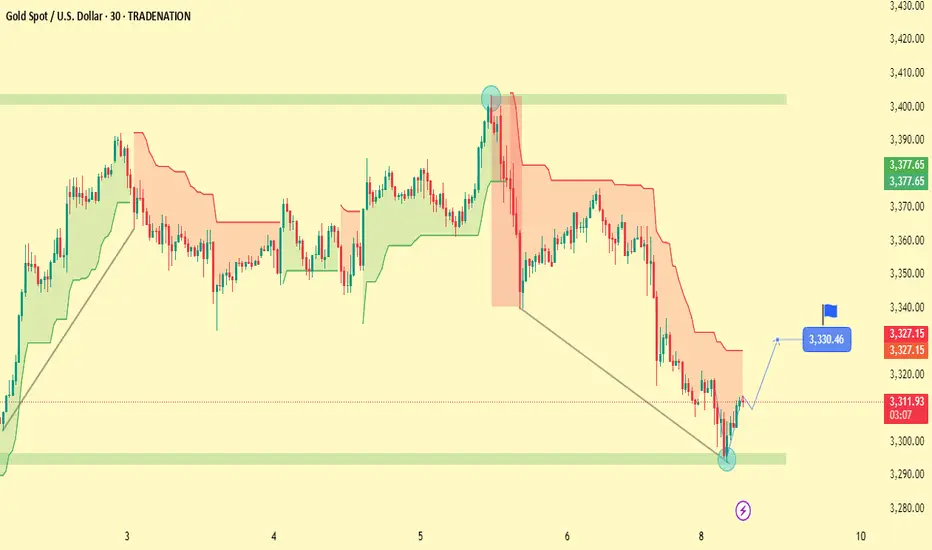
Support Zone: ~$3,290
Resistance Zone: ~$3,400
Current Price Area: Rebounding from ~$3,290
Target Projection: ~$3,330.46 (marked on chart)
---
🧠 Key Technical Observations
1. Double Top Formation Near $3,400:
The price formed a classic double top pattern at the $3,400 level, a bearish signal indicating strong supply.
After the second rejection, price declined sharply.
2. Strong Support Rebound:
Price found significant support around $3,290 — a previously tested demand zone.
Bullish candlesticks (possibly engulfing or pin bars) suggest renewed buying interest.
3. Trendline Retest:
The chart shows a successful retest of a previously broken trendline from above, confirming the structure as new support.
This strengthens the case for a reversal.
4. Bullish Price Action:
Price is now moving upward with momentum.
The projected path toward $3,330.46 implies a bullish continuation setup — possibly an ascending triangle or a flag pattern breakout forming.
---
📈 What to Watch Next
Break of Minor Resistance: If price clears ~$3,315–$3,320, it may accelerate toward the ~$3,330 target.
Volume Confirmation (if available): A rise in volume would confirm strength behind this move.
Bearish Risk: A failure to hold above $3,290 again would invalidate the bullish setup and open the door to further downside.
---
✅ Conclusion
Gold (XAU/USD) is showing strong signs of a bullish reversal after defending a key support zone. If momentum holds and resistance levels are cleared, a move toward $3,330 and potentially back to $3,400 could be on the table. Traders should watch for confirmation via price action or breakout candles before entering long positions.
Trade active
Trade closed: target reached
Related publications
Disclaimer
The information and publications are not meant to be, and do not constitute, financial, investment, trading, or other types of advice or recommendations supplied or endorsed by TradingView. Read more in the Terms of Use.
Related publications
Disclaimer
The information and publications are not meant to be, and do not constitute, financial, investment, trading, or other types of advice or recommendations supplied or endorsed by TradingView. Read more in the Terms of Use.