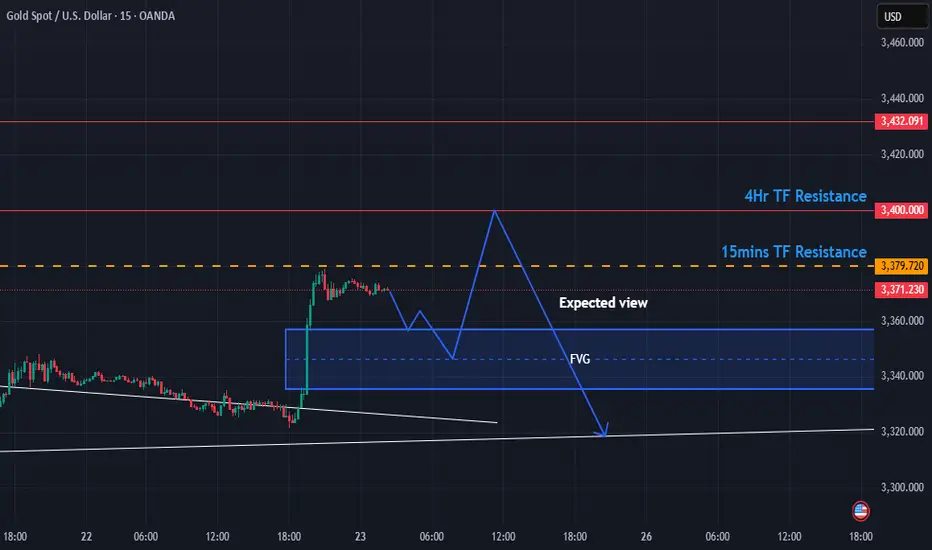
1. Key Resistance Zones:
3,379.720 – 15-Minute TF Resistance (Orange dashed line):
A recent price level where price previously faced rejection; short-term resistance.
3,400.000 – 4-Hour TF Resistance (Red line):
A higher timeframe resistance level; typically more significant and harder to break.
2. Current Price Level:
3,371.230: Price is just below the 15min resistance, suggesting possible consolidation or a pullback.
3. FVG – Fair Value Gap (Blue Box):
This is a price imbalance area where a large move left inefficiency (i.e., not enough buying/selling occurred). Price is expected to revisit this area to “fill” the gap before continuing a major move.
4. Expected Price Action (Blue Zig-Zag Path):
These analysis believes:
A pullback into the FVG zone (around 3,340-3,350).
A rejection or bounce from this FVG area.
A short-term push toward or above the 15min resistance.
A final drop after tapping liquidity or a resistance level, likely targeting below 3,320.
Interpreting the Expected Move:
Pullback to FVG:
Suggests the current market is overextended after a rapid move up (seen in the sharp green candle).
Price often retraces to fair value to “correct” this imbalance.
Short-Term Rally:
After the FVG fill, a bullish push is expected, potentially as a liquidity grab near the 15min or 4hr resistance.
Final Bearish Drop:
The longer-term view is bearish after the rally.
Possibly targeting support or trendline near 3,320. On basis of Powell speech for expect rate cut creates te sudden upward movement on last Friday. On coming week If the Ukraine and Russia war end then expecting deep fall from 3400 area levels if the peace speech went well between Trump,Zelenski and putin.
Disclaimer
The information and publications are not meant to be, and do not constitute, financial, investment, trading, or other types of advice or recommendations supplied or endorsed by TradingView. Read more in the Terms of Use.
Disclaimer
The information and publications are not meant to be, and do not constitute, financial, investment, trading, or other types of advice or recommendations supplied or endorsed by TradingView. Read more in the Terms of Use.
