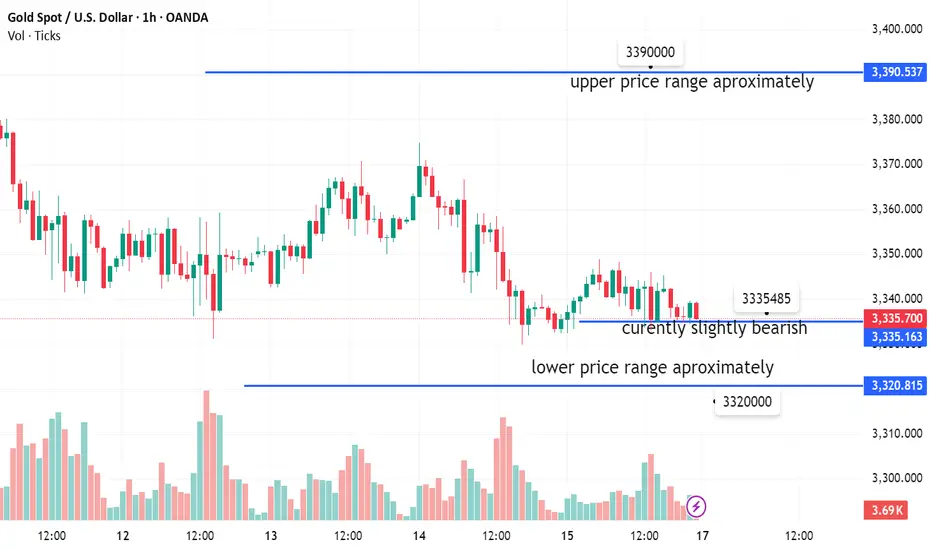
🔎 Briefing:
The chart represents hourly candlestick price movements of a currency pair (from OANDA broker).
Time Period Shown: August 13–15, 2025.
Price Range: Approximately 3,320,000 – 3,390,000.
Trend Observation:
On Aug 13, the price declined steadily, reaching a low around 3,333,000 on Aug 15.
A recovery attempt followed, with short bullish candles pushing prices higher before facing resistance near 3,345,000–3,346,000.
Candlestick Colors:
Red candles = bearish (closing lower than opening).
Green candles = bullish (closing higher than opening).
Market Sentiment: Currently slightly bearish, as the last candle closed lower at 3,335,485 (-0.22%).
Volume: Histogram bars (left side) indicate trading activity, with higher participation during key moves.
Please Leave Comments thanks
JOIN MY BEST SIGNAL CHANNWEL t.me/bestforexsignalsedvq
Disclaimer
The information and publications are not meant to be, and do not constitute, financial, investment, trading, or other types of advice or recommendations supplied or endorsed by TradingView. Read more in the Terms of Use.
JOIN MY BEST SIGNAL CHANNWEL t.me/bestforexsignalsedvq
Disclaimer
The information and publications are not meant to be, and do not constitute, financial, investment, trading, or other types of advice or recommendations supplied or endorsed by TradingView. Read more in the Terms of Use.