📉 Gold Price Analysis: Bearish Outlook Deepens as Key Demand Zone Faces Pressure (June 29, 2025)
Gold (XAU/USD) has shown significant bearish momentum in recent days, with clear signals of institutional distribution and strong supply zones keeping the bulls under pressure. Let's break down the price action using a combination of Smart Money Concepts (SMC), supply and demand zones, and classic market structure.
---
📊 Current Price Snapshot
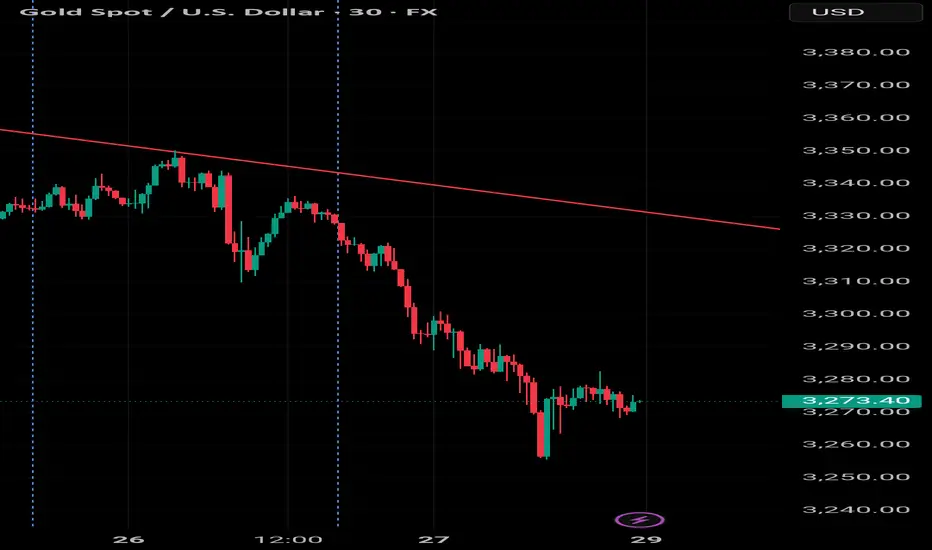
Instrument: Gold (XAU/USD
Current Price: $3,273.40
Timeframe: 30 mins (intraday swing structure)
Bias: Bearish until structure shifts
---
🔍 Market Structure Breakdown
Gold has maintained a bearish market structure over the past several sessions. This trend is supported by:
A series of Lower Highs (LH) and Lower Lows (LL)
Multiple Breaks of Structure (BOS) confirming bearish continuation
Failed Change of Character (CHoCH) attempts that could not sustain bullish momentum
Notably, the most recent LH occurred around $3,356, followed by a steep drop to form a new LL near $3,273, right at a major demand zone.
---
🟥 Key Supply Zones (Resistance)
🔺 Zone 1: $3,355 – $3,365
Labeled as a Strong Supply Zone
Previous liquidity grab occurred here, followed by aggressive selling
Clear rejection and BOS to the downside confirm institutional presence
🔺 Zone 2: $3,321 – $3,335
A minor but significant supply zone acting as intraday resistance
Multiple rejections from this area during pullbacks
Aligns with a descending trendline drawn from the recent highs
---
🟦 Key Demand Zone (Support)
🟦 Zone: $3,245 – $3,273
Labeled as a Key Demand Zone
Price is currently consolidating at the top of this zone
Reaction here will determine whether bulls can gain ground or if further downside is imminent
---
🧠 Smart Money Concepts In Action
BOS (Break of Structure) has repeatedly occurred to the downside — these are institutional footprints of bearish intent.
CHoCH (Change of Character) attempts have failed to hold, reinforcing bearish pressure.
Liquidity has been swept above the $3,355 level, suggesting that the smart money is now aiming for liquidity below the demand zone.
---
🔮 Forecast Scenarios
📉 Primary Bearish Scenario
If price breaks below the $3,245 level, expect a strong continuation downward.
Potential downside targets: $3,220, and ultimately $3,200
Traders may look for short entries on retests of the $3,321–$3,335 supply zone
📈 Alternate Bullish Reversal Scenario
A valid CHoCH and bullish BOS above $3,321 could signal a reversal
If that happens, watch for a rally toward $3,345 and possibly another test of the $3,355–$3,365 supply zone
This would require strong bullish volume and confirmation candles at the demand zone
---
📌 Key Technical Levels
Level Type Price Range Notes
Supply $3,355–$3,365 Strong institutional resistance
Supply $3,321–$3,335 Mid-level supply / pullback zone
Demand $3,245–$3,273 Key support; current price area
Support ~$3,270 Consolidation zone equilibrium
Target ~$3,200 Bearish continuation target
---
✅ Trading Strategy Suggestions
Short Bias: Sell from $3,321–$3,335 zone if price rejects with bearish candles or imbalance
Long Bias (Cautious): Only consider longs if BOS + CHoCH are confirmed above $3,321, with high-volume candles
---
📘 Final Thoughts
Gold remains in a bearish environment, with institutional footprints signaling a potential continuation toward lower levels. The price action around the $3,245–$3,273 demand zone will be crucial in determining the next directional move.
Until a confirmed structural reversal occurs, the path of least resistance remains downward. Traders should watch for liquidity grabs, rejection candles, and structural confirmations to frame their entries and exits.
---
Stay tuned for further updates and real-time price action breakdowns. Risk management is key — trade safe and smart! 💼📉
Gold (XAU/USD) has shown significant bearish momentum in recent days, with clear signals of institutional distribution and strong supply zones keeping the bulls under pressure. Let's break down the price action using a combination of Smart Money Concepts (SMC), supply and demand zones, and classic market structure.
---
📊 Current Price Snapshot
Instrument: Gold (XAU/USD
Current Price: $3,273.40
Timeframe: 30 mins (intraday swing structure)
Bias: Bearish until structure shifts
---
🔍 Market Structure Breakdown
Gold has maintained a bearish market structure over the past several sessions. This trend is supported by:
A series of Lower Highs (LH) and Lower Lows (LL)
Multiple Breaks of Structure (BOS) confirming bearish continuation
Failed Change of Character (CHoCH) attempts that could not sustain bullish momentum
Notably, the most recent LH occurred around $3,356, followed by a steep drop to form a new LL near $3,273, right at a major demand zone.
---
🟥 Key Supply Zones (Resistance)
🔺 Zone 1: $3,355 – $3,365
Labeled as a Strong Supply Zone
Previous liquidity grab occurred here, followed by aggressive selling
Clear rejection and BOS to the downside confirm institutional presence
🔺 Zone 2: $3,321 – $3,335
A minor but significant supply zone acting as intraday resistance
Multiple rejections from this area during pullbacks
Aligns with a descending trendline drawn from the recent highs
---
🟦 Key Demand Zone (Support)
🟦 Zone: $3,245 – $3,273
Labeled as a Key Demand Zone
Price is currently consolidating at the top of this zone
Reaction here will determine whether bulls can gain ground or if further downside is imminent
---
🧠 Smart Money Concepts In Action
BOS (Break of Structure) has repeatedly occurred to the downside — these are institutional footprints of bearish intent.
CHoCH (Change of Character) attempts have failed to hold, reinforcing bearish pressure.
Liquidity has been swept above the $3,355 level, suggesting that the smart money is now aiming for liquidity below the demand zone.
---
🔮 Forecast Scenarios
📉 Primary Bearish Scenario
If price breaks below the $3,245 level, expect a strong continuation downward.
Potential downside targets: $3,220, and ultimately $3,200
Traders may look for short entries on retests of the $3,321–$3,335 supply zone
📈 Alternate Bullish Reversal Scenario
A valid CHoCH and bullish BOS above $3,321 could signal a reversal
If that happens, watch for a rally toward $3,345 and possibly another test of the $3,355–$3,365 supply zone
This would require strong bullish volume and confirmation candles at the demand zone
---
📌 Key Technical Levels
Level Type Price Range Notes
Supply $3,355–$3,365 Strong institutional resistance
Supply $3,321–$3,335 Mid-level supply / pullback zone
Demand $3,245–$3,273 Key support; current price area
Support ~$3,270 Consolidation zone equilibrium
Target ~$3,200 Bearish continuation target
---
✅ Trading Strategy Suggestions
Short Bias: Sell from $3,321–$3,335 zone if price rejects with bearish candles or imbalance
Long Bias (Cautious): Only consider longs if BOS + CHoCH are confirmed above $3,321, with high-volume candles
---
📘 Final Thoughts
Gold remains in a bearish environment, with institutional footprints signaling a potential continuation toward lower levels. The price action around the $3,245–$3,273 demand zone will be crucial in determining the next directional move.
Until a confirmed structural reversal occurs, the path of least resistance remains downward. Traders should watch for liquidity grabs, rejection candles, and structural confirmations to frame their entries and exits.
---
Stay tuned for further updates and real-time price action breakdowns. Risk management is key — trade safe and smart! 💼📉
Disclaimer
The information and publications are not meant to be, and do not constitute, financial, investment, trading, or other types of advice or recommendations supplied or endorsed by TradingView. Read more in the Terms of Use.
Disclaimer
The information and publications are not meant to be, and do not constitute, financial, investment, trading, or other types of advice or recommendations supplied or endorsed by TradingView. Read more in the Terms of Use.