Daily Timeframe Analysis
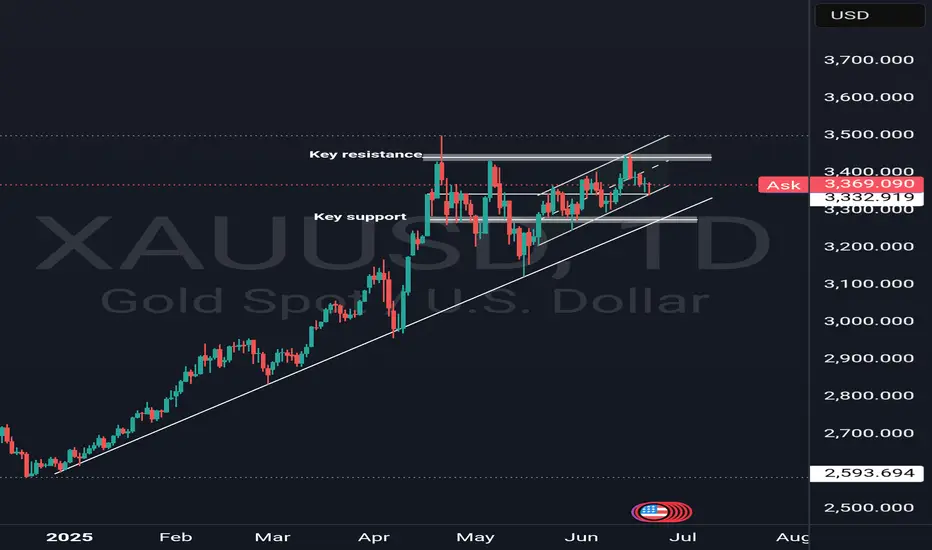
Gold continues to respect its medium to long-term bullish structure on the daily timeframe. Despite the ongoing geopolitical tensions and war-driven headlines, price action has experienced a corrective pullback from the key resistance area near 3430.
Importantly, gold appears to be forming a minor bullish channel within a broader consolidation zone suggesting that price is currently in a range-bound correction phase nested inside a higher-timeframe uptrend. The channel structure reflects healthy consolidation, not a trend reversal.
Chart Reference: Daily Chart

3-Hour Timeframe (Intraday Structure)
The 3H chart shows price recently reacting from the bullish channel support, confluenced with a demand zone and the Fibonacci golden zone indicating a strong technical base. A new fresh demand zone has been created as a result of this reaction.
Price is currently holding above the minor intraday structure at 3365.
If this level holds, short-term targets are 3377 – 3380.
A confirmed break and retest above 3380 opens up the next leg toward 3400 – 3404 resistance.
Chart References:


Fundamental Backdrop
A combination of macroeconomic and sentiment-based indicators support the bullish bias:
COT (Commitment of Traders) data shows institutional positioning remains net long on gold.
Retail sentiment is skewed towards short, which historically supports upside moves.
Seasonal bias for gold typically favors strength during mid-to-late Q2.
US economic indicators show signs of cooling:
Manufacturing PMI & Services PMI have slowed.
Retail sales remain soft.
Inflation readings suggest disinflationary pressure.
These factors collectively weaken the US dollar, adding upside pressure to gold.
Downside Risk / Bearish Scenario
If price fails to hold above 3365 and decisively breaks below the current channel, we could see a deeper correction toward the 3300–3280 area of interest which aligns with a major support, daily bullish trendline, and longer-term reaccumulation zone.

15-Minute Timeframe (Microstructure Insight)
On the 15M chart, gold rallied from the channel base and demand zone, but has since entered a consolidation phase between 3365 and 3372. A Fair Value Gap (FVG) lies just beneath the 3365 pivot — suggesting the potential for a liquidity sweep before any continued move to the upside.
This setup is often a precursor to an aggressive expansion move, particularly during high-volume sessions (London/New York overlap).

Summary
Bias: Bullish (while above 3365)
Immediate Support: 3365
Short-Term Targets: 3377 → 3380 → 3404
Key Resistance: 3430
Bearish Invalidations: Below 3365
Gold continues to respect its medium to long-term bullish structure on the daily timeframe. Despite the ongoing geopolitical tensions and war-driven headlines, price action has experienced a corrective pullback from the key resistance area near 3430.
Importantly, gold appears to be forming a minor bullish channel within a broader consolidation zone suggesting that price is currently in a range-bound correction phase nested inside a higher-timeframe uptrend. The channel structure reflects healthy consolidation, not a trend reversal.
Chart Reference: Daily Chart
3-Hour Timeframe (Intraday Structure)
The 3H chart shows price recently reacting from the bullish channel support, confluenced with a demand zone and the Fibonacci golden zone indicating a strong technical base. A new fresh demand zone has been created as a result of this reaction.
Price is currently holding above the minor intraday structure at 3365.
If this level holds, short-term targets are 3377 – 3380.
A confirmed break and retest above 3380 opens up the next leg toward 3400 – 3404 resistance.
Chart References:
Fundamental Backdrop
A combination of macroeconomic and sentiment-based indicators support the bullish bias:
COT (Commitment of Traders) data shows institutional positioning remains net long on gold.
Retail sentiment is skewed towards short, which historically supports upside moves.
Seasonal bias for gold typically favors strength during mid-to-late Q2.
US economic indicators show signs of cooling:
Manufacturing PMI & Services PMI have slowed.
Retail sales remain soft.
Inflation readings suggest disinflationary pressure.
These factors collectively weaken the US dollar, adding upside pressure to gold.
Downside Risk / Bearish Scenario
If price fails to hold above 3365 and decisively breaks below the current channel, we could see a deeper correction toward the 3300–3280 area of interest which aligns with a major support, daily bullish trendline, and longer-term reaccumulation zone.
15-Minute Timeframe (Microstructure Insight)
On the 15M chart, gold rallied from the channel base and demand zone, but has since entered a consolidation phase between 3365 and 3372. A Fair Value Gap (FVG) lies just beneath the 3365 pivot — suggesting the potential for a liquidity sweep before any continued move to the upside.
This setup is often a precursor to an aggressive expansion move, particularly during high-volume sessions (London/New York overlap).
Summary
Bias: Bullish (while above 3365)
Immediate Support: 3365
Short-Term Targets: 3377 → 3380 → 3404
Key Resistance: 3430
Bearish Invalidations: Below 3365
Disclaimer
The information and publications are not meant to be, and do not constitute, financial, investment, trading, or other types of advice or recommendations supplied or endorsed by TradingView. Read more in the Terms of Use.
Disclaimer
The information and publications are not meant to be, and do not constitute, financial, investment, trading, or other types of advice or recommendations supplied or endorsed by TradingView. Read more in the Terms of Use.