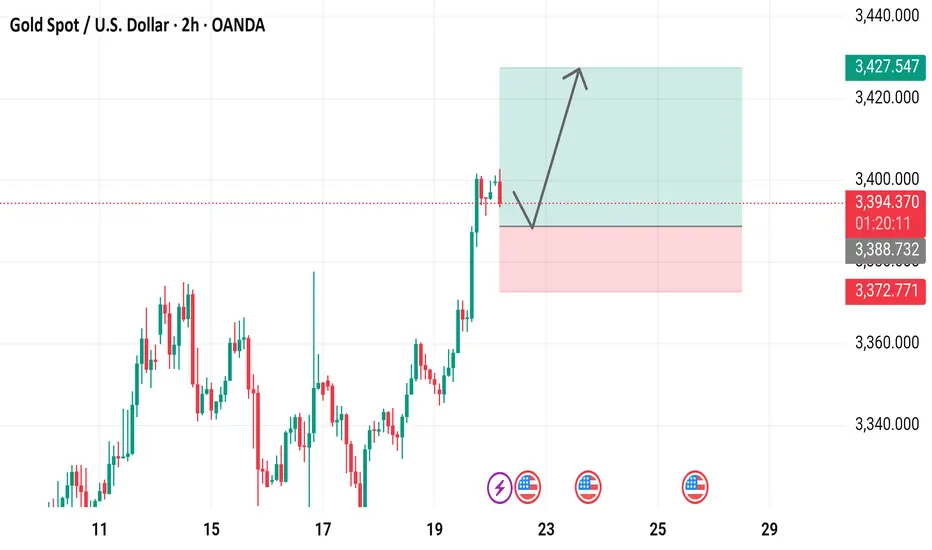
2-hour candlestick chart displays the price movement of Gold Spot against the U.S. Dollar (XAUUSD) from OANDA, covering the period up to July 22, 2025. The current price is 3,395.285, reflecting a 1.775 (-0.05%) decrease. The chart includes buy/sell indicators (3,395.780 buy, 3,394.890 sell), a highlighted resistance zone around 3,400-3,425, and a support zone around 3,370-3,386. The chart also features technical analysis tools and annotations indicating potential price trends.
Trade active
Hold your trades Guy's Trade closed: target reached
Perfect target achieved Daily XAU/USD FREE setups | Let's grow together!
| XAU/USD Trader | Telegram: https://t.me/Aleegoldsignals
| XAU/USD Trader | Telegram: https://t.me/Aleegoldsignals
Disclaimer
The information and publications are not meant to be, and do not constitute, financial, investment, trading, or other types of advice or recommendations supplied or endorsed by TradingView. Read more in the Terms of Use.
Daily XAU/USD FREE setups | Let's grow together!
| XAU/USD Trader | Telegram: https://t.me/Aleegoldsignals
| XAU/USD Trader | Telegram: https://t.me/Aleegoldsignals
Disclaimer
The information and publications are not meant to be, and do not constitute, financial, investment, trading, or other types of advice or recommendations supplied or endorsed by TradingView. Read more in the Terms of Use.