Core Drivers
Expectations of Easing Support Gold Prices
The market anticipates a 25 basis point rate cut by the Federal Reserve in September with a probability exceeding 90%, potentially leading to two rate cuts this year. This lowers the cost of holding gold, an interest-free asset, and strengthens the medium- to long-term bullish outlook.
A modest rebound in the US dollar index (stabilizing after a one-week low) and rising US stocks will limit gold's gains in the short term, but risk aversion (due to trade uncertainty) provides hedging support.
Key Technical Signals
Daily Chart:
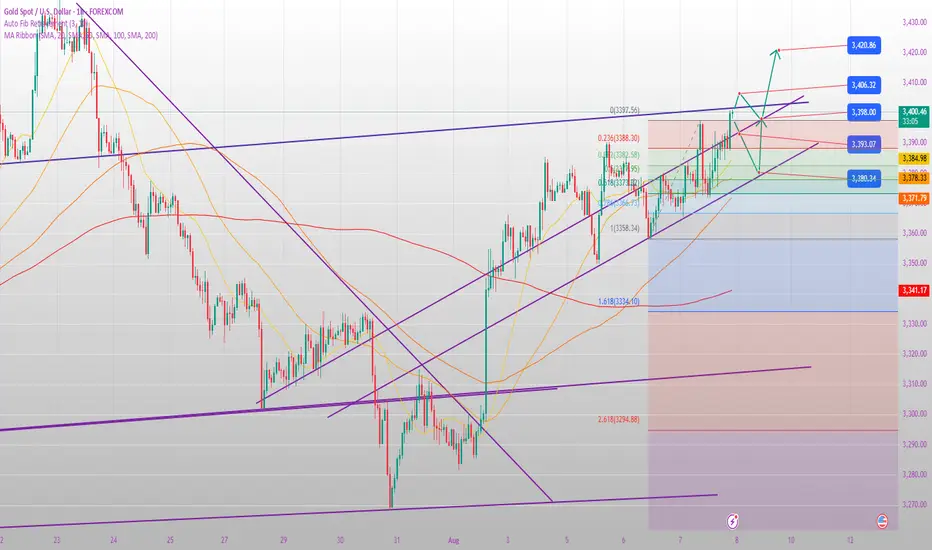
The market is nearing the end of a converging triangle, with upper support moving down to 3406 and lower support moving up to 3360.
Thursday's close firmly above the 5-day moving average, with the MACD trend showing a mild bullish bias. A break above 3400 would open up upside potential.
4-Hour Chart:
Middle support at 3371-3372 resonates with the daily 5-day moving average. A breakout above the downward trend line in the Asian session and a pullback confirm this, indicating a short-term bullish bias. The 4-hour MACD top divergence needs to be repaired. If the price retraces but does not break below 3370, the bullish outlook remains.
Day Trading Strategy
1. Long Opportunity
Entry Zone: 3370-3373 (618 retracement of overnight rally + 4-hour middle band support).
Target:
First target: 3397-3400 (Asian session high + psychological barrier).
After a breakout, target 3406 (upper band of the triangle), with further breakouts targeting 3420.
Stop Loss: Below 3365 (a break below would destroy the short-term upward trend).
2. Be cautious when shorting.
Conditions: If the gold price surges to around 3406 and then experiences pressure and a rapid decline, a small position can be considered for a short position.
Target: 3380-3375.
Stop Loss: Above 3412.
Key Risk Warning: US Dollar Trend: A sharp rebound in the US Dollar Index (e.g., above 104.5) could suppress gold prices. Fed Commentary: If Fed officials send hawkish signals (e.g., downplaying interest rate cuts), gold prices could pull back.
Triangle Breakout: A break below 3360 could trigger a potential drop to support levels of 3340-3330; a break above 3406 would confirm a new uptrend.
Trading Recommendations
Main Strategy: Invest primarily in low-level long positions, relying on support at 3370-3372, with a stop-loss at 3365 and a target of 3400-3406.
Alternative plan: short-term short selling under pressure at 3406, enter and exit quickly.
Breakthrough follow-up: If it stabilizes at 3400 after the European session, you can chase it to 3420; otherwise, if it falls below 3360, wait and see.
Trade active
Will a black swan event occur in gold on Friday, August 8th?
Key Trading Logic
Technical Patterns
A daily bullish breakout above 3400 confirms a short-term bullish trend, but a sharp rise and fall in the early Asian session suggests potential corrections, in line with the market principle that "sharp gains in early Asian sessions are difficult to sustain."
3380-3375 is the support zone following yesterday's breakout, with 3370 being the dividing line between strength and weakness (a break below would disrupt the upward trend).
Refined Trading Strategy
Option 1: Long on Pullbacks (Main Strategy)
Entry Zone: 3380-3375 (Small positions, phased in)
Stop-loss: Strictly set below 3370 (to prevent false breakouts)
Targets:
First target: 3400 (psychological pressure at the round number mark)
Second target: 3410 (positions can be reduced near previous highs)
Holding Conditions: Price must remain above 3385 within 1 hour; otherwise, exit early.
Option 2: Breakout Reversal (Alternative Strategy)
If the price breaks below 3370 and is confirmed by the 15-minute close:
Short position with a stop loss at 3378 and a target of 3355-3360 (previous support level).
Key Considerations:
Time Window:
If the price remains below 3400 during the Asian and European sessions, the probability of a pullback before the US market opens increases; avoid chasing higher prices.
During the US trading session, monitor the impact of US economic data on the US dollar.
Position Management:
During volatile trading, reduce your position to half of your normal level, keeping total risk below 2% of your account.
Alternative plan: If the gold price breaks through 3410, wait for confirmation of a pullback to 3400 before entering a long position (to avoid false breakouts).
Trader Psychology Tips:
Avoid blind optimism: Before the daily chart shows a continuous rise, approach the market in a step-by-step manner, achieving profit targets in stages.
Strict Discipline: After a surge in the early Asian session, there is usually a secondary bottom; be sure to wait for a confirmation signal.
(Note: Actual trading strategies should be adjusted based on real-time data and breaking news. It is recommended to use the 4-hour MACD and RSI indicators to verify momentum.)
Trade closed: target reached
Will gold choose a clear direction on August 11th?
I. Current Gold Market Overview
Fundamental Factors
Safe-haven demand: Global trade tensions (such as Trump's tariff policy) and expectations of a September Fed rate cut continue to support gold prices.
Impact of the US dollar's trend: If the US dollar weakens due to weak economic data (such as the job market), gold prices may rise further; conversely, if the US dollar rebounds, gold prices may come under pressure.
Central Bank Gold Purchases: China continues to increase its gold reserves, which is positive for gold prices in the long term.
Key Technical Levels
Support: 3380 (4-hour Bollinger Band middle), 3364 (daily key support), 3350 (20-day moving average).
Resistance: 3409 (this week's high), 3415 (previous high), 3430-3450 (historical resistance zone).
II. Technical Analysis of Gold Trends
Daily Chart
Trend: The overall trend remains bullish, with the price stabilizing above the 20-day moving average (above 3350). The MACD forms a golden cross with high volume, but the RSI is approaching overbought territory, prompting caution against a pullback.
Key Observation: If the price closes above 3400, it could test 3430-3450. If it falls below 3380, it could retest the support levels of 3360-3350.
4-Hour Chart
Short-Term Momentum: The Bollinger Bands are opening upward, the price is moving along the upper band, and the MACD forms a second golden cross. However, the KDJ indicator is overbought and blunt, prompting concern about the effectiveness of the 3380 support level.
Key Breakout Directions:
Break above 3410 → target 3430-3450.
Break below 3380 → target 3360-3350.
1-Hour Chart
Swing Range: 3380-3410. If the US market breaks in this direction, trade accordingly.
III. Trading Strategy for August 11th
1. Main Trading Strategy: Buy on Pullbacks (Primarily Buy on Dips)
Entry Point: 3380-3370 (Buy after support stabilizes).
Stop Loss: Below 3360.
Target: 3400-3410 (Target 3430 after a breakout).
2. Short on Rebound Highs: Auxiliary Trading Strategy: Short on Rebound Highs
Entry Point: 3410-3415 (If a breakout fails).
Stop Loss: Above 3420.
Target: 3380-3360.
3. Breakout Strategy
Break above 3415 → Follow up with long orders on a pullback to 3400, target 3430-3450.
Break below 3360 → Short on a rebound to 3370, target 3350-3330.
IV. Risk Warning
Economic Data: This week's US inflation data and speeches by Federal Reserve officials may impact gold prices.
Geopolitical Risks: The US-Russia meeting and escalating trade wars could trigger market volatility.
Adhere to a strict stop-loss order: The current market is volatile and strong, but overbought signals exist, so be wary of a sudden pullback.
Conclusion: Gold remains bullish in the short term, but caution is advised against pullbacks from high levels. We recommend trading primarily in the 3380-3410 range, with a follow-up move after a breakout.
Related publications
Disclaimer
The information and publications are not meant to be, and do not constitute, financial, investment, trading, or other types of advice or recommendations supplied or endorsed by TradingView. Read more in the Terms of Use.
Related publications
Disclaimer
The information and publications are not meant to be, and do not constitute, financial, investment, trading, or other types of advice or recommendations supplied or endorsed by TradingView. Read more in the Terms of Use.