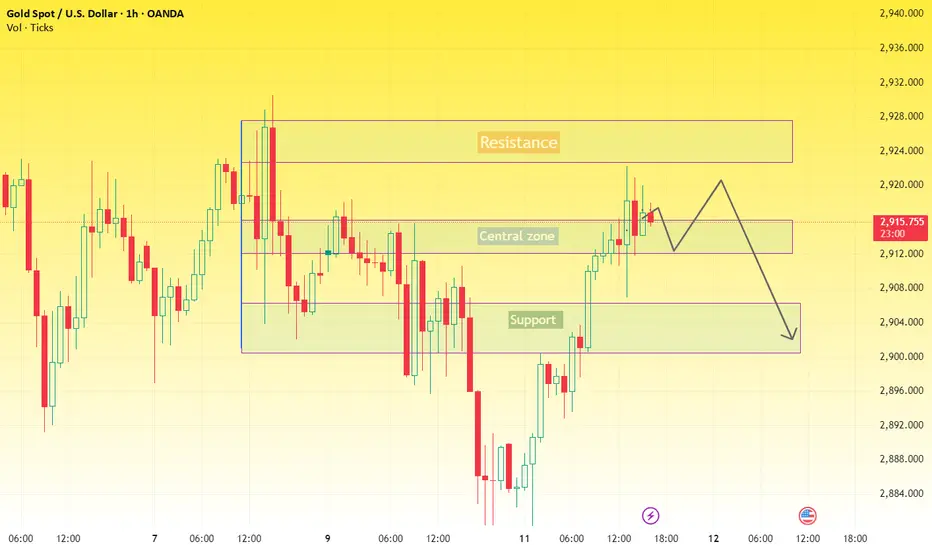
This is a technical analysis chart for Gold Spot (XAU/USD) on a 1-hour timeframe, published on TradingView.
Key Elements in the Chart:
1. Price Level: The current price is 2,917.070, with a +0.95% increase.
2. Support & Resistance Zones:
Resistance Zone (Top Box): A price range where selling pressure is expected to be strong, preventing further upward movement.
Central Zone (Middle Box): A potential area of price fluctuation and consolidation.
Support Zone (Bottom Box): A price range where buying pressure may be strong enough to prevent further decline.
3. Forecasted Movement (Arrows):
The chart suggests a potential price rejection at the resistance zone, followed by a retracement towards the support zone around 2,900.
There may be a minor bounce at the central zone, but overall, the expectation is a decline after testing resistance.
Conclusion:
The analysis implies that traders should watch for resistance rejection and a potential move down toward support. If the price breaks through resistance, the bearish outlook might be invalidated.
Trade active
Trade closed manually
my target is 70 running Note
trade active 150 pips runningDisclaimer
The information and publications are not meant to be, and do not constitute, financial, investment, trading, or other types of advice or recommendations supplied or endorsed by TradingView. Read more in the Terms of Use.
Disclaimer
The information and publications are not meant to be, and do not constitute, financial, investment, trading, or other types of advice or recommendations supplied or endorsed by TradingView. Read more in the Terms of Use.