Gold (XAU/USD) Setup based on 30-minute chart
**Bullish Scenario**
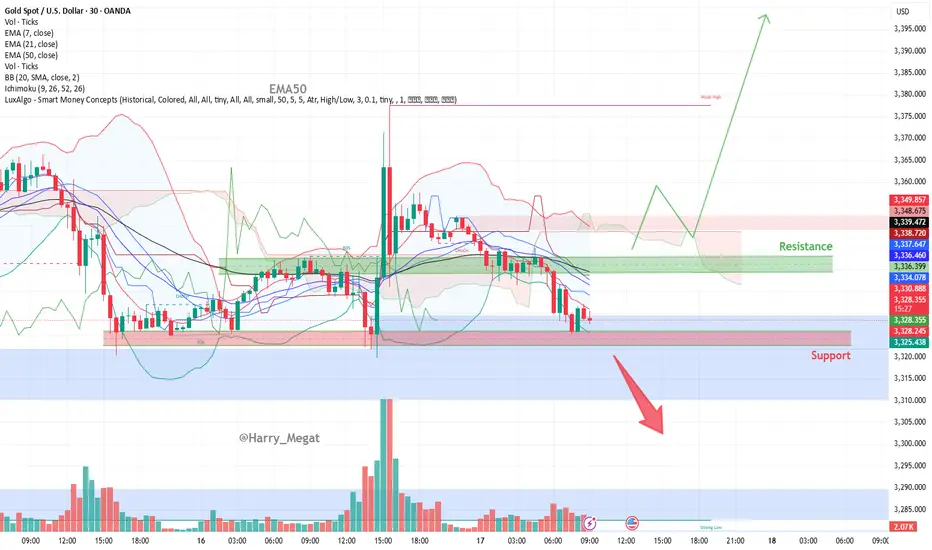
* **Support Held**: Price is currently testing a key horizontal support zone (\~\$3,320–\$3,327), which has held multiple times in the past.
* **Potential Reversal**: If price forms a bullish candlestick pattern here (e.g., bullish engulfing, hammer), we may see a rebound.
* **Upside Target**:
* **First Resistance**: \$3,345–\$3,350 (green zone)
* **Further Target**: \$3,380–\$3,400 if momentum continues
**Confirmation Triggers**:
* Bullish price action from support zone
* Break above EMA 7 / EMA 21 (\~\$3,330–\$3,336)
* Increasing volume on green candles
**Bearish Scenario**
* **Breakdown Threat**: Price is hovering near support; if it breaks below \$3,320 with volume, downside pressure may intensify.
* **Next Support Levels**:
* \$3,310 (minor)
* \$3,285–\$3,275 (major support)
**Bearish Triggers**:
* Clear break and close below \$3,320
* EMA crossover (short-term below long-term)
* Rising red volume bars
Summary
| Direction | Conditions | Targets |
| ---------- | --------------------------------------------------- | ------------------------- |
| Bullish | Hold above \$3,320 + breakout above \$3,336 (EMA50) | \$3,350 → \$3,380–\$3,400 |
| Bearish | Break below \$3,320 support | \$3,310 → \$3,285 |

**Bullish Scenario**
* **Support Held**: Price is currently testing a key horizontal support zone (\~\$3,320–\$3,327), which has held multiple times in the past.
* **Potential Reversal**: If price forms a bullish candlestick pattern here (e.g., bullish engulfing, hammer), we may see a rebound.
* **Upside Target**:
* **First Resistance**: \$3,345–\$3,350 (green zone)
* **Further Target**: \$3,380–\$3,400 if momentum continues
**Confirmation Triggers**:
* Bullish price action from support zone
* Break above EMA 7 / EMA 21 (\~\$3,330–\$3,336)
* Increasing volume on green candles
**Bearish Scenario**
* **Breakdown Threat**: Price is hovering near support; if it breaks below \$3,320 with volume, downside pressure may intensify.
* **Next Support Levels**:
* \$3,310 (minor)
* \$3,285–\$3,275 (major support)
**Bearish Triggers**:
* Clear break and close below \$3,320
* EMA crossover (short-term below long-term)
* Rising red volume bars
Summary
| Direction | Conditions | Targets |
| ---------- | --------------------------------------------------- | ------------------------- |
| Bullish | Hold above \$3,320 + breakout above \$3,336 (EMA50) | \$3,350 → \$3,380–\$3,400 |
| Bearish | Break below \$3,320 support | \$3,310 → \$3,285 |
Trade active
The gold price recently **broke below a key support level**, signaling a **bearish shift** in market sentiment. Here's a breakdown of what this means:**Explanation of the Bearish Setup:**
1. **Breakout Below Support:**
* Support levels are price zones where buyers typically step in. When price breaks below support, it suggests that **selling pressure is stronger** than buying interest.
* In this case, gold broke below its support, confirming that sellers are in control.
2. **Bearish Confirmation:**
* After the breakdown, price **continued downward** and hit **\$3,312**, which was likely a target area based on technical analysis.
* This successful move confirms the **validity of the bearish setup**.
3. **Technical Indicators May Support It:**
* may also have seen confirmation from indicators like:
* **RSI dropping below 50** → showing weakening momentum.
* **MACD bearish crossover** → signaling a potential downtrend.
* **EMA or trendline break** → validating the shift in direction.
What’s Next
* As long as gold remains **below the broken support level**, further downside is possible.
* If price retests the old support (now resistance) and fails to reclaim it, it could invite more sellers into the market.
Trade closed: target reached
🔻 Gold Analysis UpdatePrice Action:
Gold has broken key support at 3320 and dropped to 3310, confirming strong bearish momentum.
📉 Outlook:
As long as price stays below 3320, further downside remains possible.
Key Levels:
Resistance: 3320 / 3335
Support: 3300 / 3285
🔔 Traders Note:
Avoid long entries unless price reclaims 3320 with strong confirmation.
Disclaimer
The information and publications are not meant to be, and do not constitute, financial, investment, trading, or other types of advice or recommendations supplied or endorsed by TradingView. Read more in the Terms of Use.
Disclaimer
The information and publications are not meant to be, and do not constitute, financial, investment, trading, or other types of advice or recommendations supplied or endorsed by TradingView. Read more in the Terms of Use.