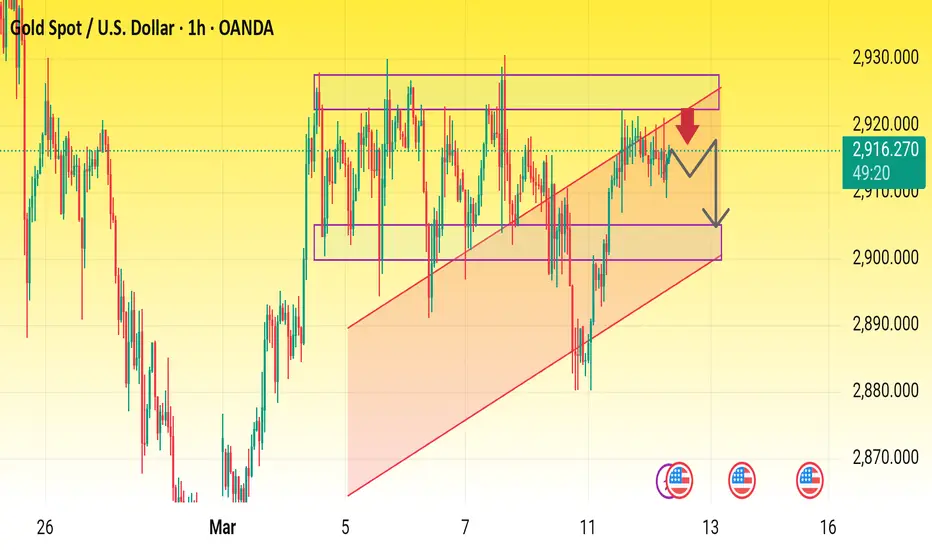
This is a Gold Spot (XAU/USD) 1-hour chart from TradingView, showing price action within a rising channel. Here's what the chart indicates:
Key Observations:
1. Resistance Zone (~$2,920-$2,925):
Price is testing a strong resistance area (marked by the red horizontal line at the top).
A red arrow suggests a potential rejection from this level.
2. Expected Price Movement (Bearish Bias):
The gray zig-zag arrow suggests a possible price drop after failing to break above resistance.
The expected target is around $2,905-$2,900, which is the lower support zone (marked by the lower purple box).
3. Trendline Support & Breakout Watch:
Price has been moving in a rising channel (marked by red diagonal trendlines).
A break below the midline of the channel could lead to further downside.
4. Fundamental Triggers (U.S. Economic Events):
The U.S. flag icons indicate upcoming economic events, which might increase volatility in gold.
Trading Plan Based on This Chart:
Sell near resistance ($2,920-$2,925) with a target of $2,905-$2,900.
Stop-loss above $2,930 to protect against a breakout.
If price breaks support, further downside could be expected.
Would you like a more detailed trade setup based on this?
Disclaimer
The information and publications are not meant to be, and do not constitute, financial, investment, trading, or other types of advice or recommendations supplied or endorsed by TradingView. Read more in the Terms of Use.
Disclaimer
The information and publications are not meant to be, and do not constitute, financial, investment, trading, or other types of advice or recommendations supplied or endorsed by TradingView. Read more in the Terms of Use.
