Here is a bearish analysis of the gold market, based on current market dynamics and potential risk factors:
### 1. **Short-Term Technical Pressure**
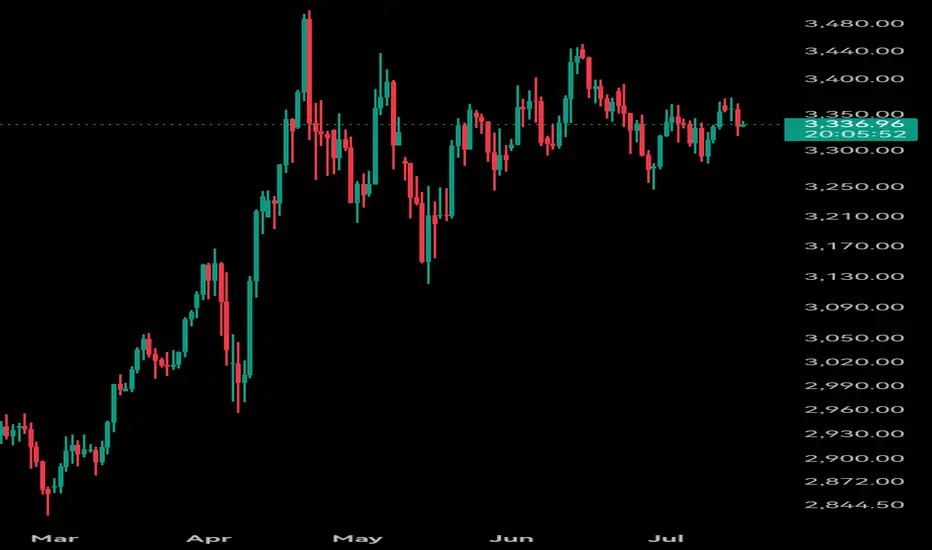
- **Key Resistance Level Suppression**: Gold recently faced strong resistance near **$3,374**, with the **0.618 Fibonacci retracement** level on the daily chart acting as a barrier. A failure to break above this level could trigger a pullback.
- **Overbought Signal**: The **RSI (14-day)** is approaching **70**, indicating overbought conditions. While the **MACD** has formed a golden cross, momentum appears weak, suggesting a potential short-term correction.
- **Double-Top Pattern Risk**: If gold fails to sustain above **$3,374**, a **double-top pattern** could form, leading to a further decline toward the **$3,356** support level.
### 2. **Fed Policy Expectations in Flux**
- **Rate Cut Expectations Priced In**: Markets have already priced in a **90%+ probability of a September Fed rate cut**. If upcoming economic data (e.g., CPI, jobs reports) surprise to the upside, these expectations could diminish, putting downward pressure on gold.
- **Sticky Inflation Risk**: If **June CPI** exceeds expectations (market consensus: **3.1% YoY**), real interest rates could rise, increasing the opportunity cost of holding gold.
### 3. **Declining Safe-Haven Demand**
- **Tariff Policy Fatigue**: Market reactions to **Trump’s tariff policies** have weakened. Any progress in **US-China or EU trade talks** could further reduce safe-haven demand.
- **Geopolitical De-escalation**: Signs of **Russia-Ukraine peace talks** or easing **Middle East tensions** may reduce gold’s appeal as a hedge.
### 4. **Institutional Bearish Sentiment**
- **Citi Warns of a Gold Peak**: Citi analysts suggest gold may trade in a **$3,100–$3,500 range in H2 2025**, but a deeper correction could occur in **2026** if global economic concerns ease and household gold holdings remain elevated.
- **High Household Holdings Risk**: Global household gold allocations are at **50-year highs** (e.g., **15–18% in India**), potentially limiting future buying power and acting as a downside catalyst.
### 5. **Stronger Dollar & Rising Treasury Yields**
- **Dollar Strength**: If the **Fed delays rate cuts** or US economic data outperforms, the **USD could rebound**, weighing on dollar-denominated gold.
- **Higher Bond Yields**: A rise in the **10-year Treasury yield above 4.5%** would increase gold’s opportunity cost, making it less attractive.
### **Potential Downside Targets**
- **Short-Term Support**: **$3,260** (key psychological level). A break below could test **$3,225** or even **$3,200**.
- **Medium-Term Correction Risk**: If risk appetite improves, gold may enter a deeper pullback toward **$3,000–$3,100**.
### **Conclusion**
While gold’s long-term outlook remains supported by **central bank buying and de-dollarization trends**, short-term risks include **overbought conditions, shifting Fed expectations, and fading safe-haven demand**. Traders should monitor **key data (CPI, NFP) and Fed signals**—a break below **$3,260** could confirm a bearish trend.
### 1. **Short-Term Technical Pressure**
- **Key Resistance Level Suppression**: Gold recently faced strong resistance near **$3,374**, with the **0.618 Fibonacci retracement** level on the daily chart acting as a barrier. A failure to break above this level could trigger a pullback.
- **Overbought Signal**: The **RSI (14-day)** is approaching **70**, indicating overbought conditions. While the **MACD** has formed a golden cross, momentum appears weak, suggesting a potential short-term correction.
- **Double-Top Pattern Risk**: If gold fails to sustain above **$3,374**, a **double-top pattern** could form, leading to a further decline toward the **$3,356** support level.
### 2. **Fed Policy Expectations in Flux**
- **Rate Cut Expectations Priced In**: Markets have already priced in a **90%+ probability of a September Fed rate cut**. If upcoming economic data (e.g., CPI, jobs reports) surprise to the upside, these expectations could diminish, putting downward pressure on gold.
- **Sticky Inflation Risk**: If **June CPI** exceeds expectations (market consensus: **3.1% YoY**), real interest rates could rise, increasing the opportunity cost of holding gold.
### 3. **Declining Safe-Haven Demand**
- **Tariff Policy Fatigue**: Market reactions to **Trump’s tariff policies** have weakened. Any progress in **US-China or EU trade talks** could further reduce safe-haven demand.
- **Geopolitical De-escalation**: Signs of **Russia-Ukraine peace talks** or easing **Middle East tensions** may reduce gold’s appeal as a hedge.
### 4. **Institutional Bearish Sentiment**
- **Citi Warns of a Gold Peak**: Citi analysts suggest gold may trade in a **$3,100–$3,500 range in H2 2025**, but a deeper correction could occur in **2026** if global economic concerns ease and household gold holdings remain elevated.
- **High Household Holdings Risk**: Global household gold allocations are at **50-year highs** (e.g., **15–18% in India**), potentially limiting future buying power and acting as a downside catalyst.
### 5. **Stronger Dollar & Rising Treasury Yields**
- **Dollar Strength**: If the **Fed delays rate cuts** or US economic data outperforms, the **USD could rebound**, weighing on dollar-denominated gold.
- **Higher Bond Yields**: A rise in the **10-year Treasury yield above 4.5%** would increase gold’s opportunity cost, making it less attractive.
### **Potential Downside Targets**
- **Short-Term Support**: **$3,260** (key psychological level). A break below could test **$3,225** or even **$3,200**.
- **Medium-Term Correction Risk**: If risk appetite improves, gold may enter a deeper pullback toward **$3,000–$3,100**.
### **Conclusion**
While gold’s long-term outlook remains supported by **central bank buying and de-dollarization trends**, short-term risks include **overbought conditions, shifting Fed expectations, and fading safe-haven demand**. Traders should monitor **key data (CPI, NFP) and Fed signals**—a break below **$3,260** could confirm a bearish trend.
Disclaimer
The information and publications are not meant to be, and do not constitute, financial, investment, trading, or other types of advice or recommendations supplied or endorsed by TradingView. Read more in the Terms of Use.
Disclaimer
The information and publications are not meant to be, and do not constitute, financial, investment, trading, or other types of advice or recommendations supplied or endorsed by TradingView. Read more in the Terms of Use.