I. Core Driver: Surprise in Non-Farm Payrolls Strengthens Rate Cut Expectations
July's non-farm payroll data significantly missed expectations
Market Reaction: Gold Soars, US Dollar Plummets
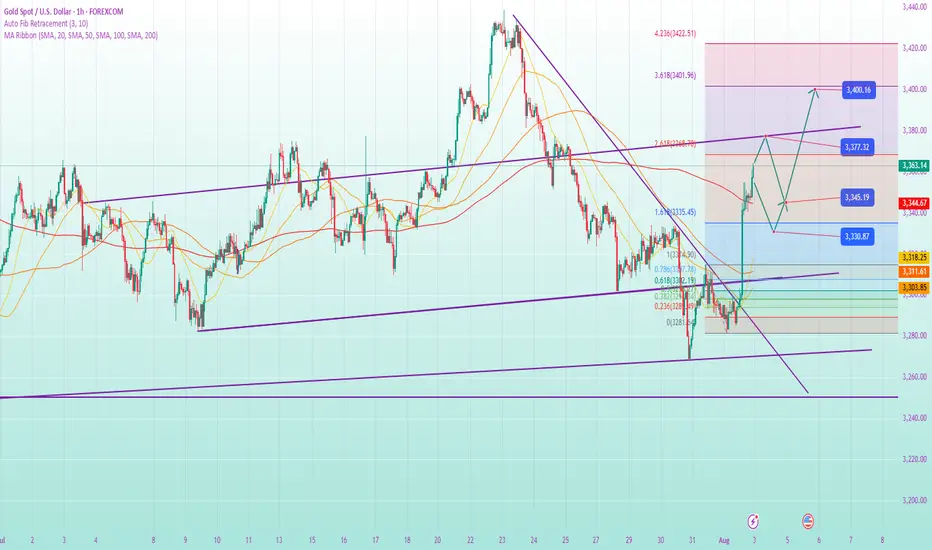
Gold surged over $60 in a single day (3300 → 3362), breaking through key resistance, and technically shifting to a strong bullish bias.
The US dollar index plummeted, raising the probability of a September rate cut to over 80%, with two rate cuts possible this year.
II. Technical Analysis: Bullish, Watch for Breakthroughs of Key Resistance
Trend Structure
A large bullish candlestick on the daily chart engulfed this week's losses, confirming a breakout above the 3300 level. Short-term targets are 3375-3385.
The MACD golden cross with strong volume and the RSI overbought but not blunted indicate strong upward momentum and potential upside potential after a pullback.
Key Price Levels
Support Levels: 3340-3335 (top-bottom reversal level), 3300 (psychological barrier). Resistance levels: 3375-3385 (previous high), 3400 (round number).
Trading strategy
Primarily buy low: Arrange long positions on dips back to 3340-3345, with a stop-loss below 3330, and a target of 3375 → 3400.
Caution on shorting at highs: Test short positions with a small position at 3380-3390 (in conjunction with overbought signals), with a stop-loss above 3400, and enter and exit quickly.
III. Key events to watch next week
Federal Reserve official speeches
Any dovish signal regarding a September rate cut could boost gold, while hawkish comments could trigger a short-term correction.
IV. Risk warning
Technical correction risk: Gold has seen excessive short-term gains. If the US dollar rebounds or profit-taking occurs, it could fall back to 3330-3340.
Inflation data disruption: If PPI exceeds expectations next week, it could weaken expectations of a rate cut and suppress gold prices. Geopolitics: If tensions in the Middle East and between Russia and Ukraine escalate, safe-haven demand could push gold above 3400.
V. Summary and Trading Plan
Trend Direction: Bullish in the short term, but be wary of resistance in the 3380-3400 area.
Key Strategies:
Breakout above 3385: Go long, targeting 3400 → 3450.
Break below 3330: Wait and see, waiting for renewed long positions around 3300.
Position Management: Avoid chasing highs; adopt phased entry and trailing stop-loss strategies (e.g., move the stop-loss for a long position at 3340 to 3350).
Trade active
August 4th Gold Trading Strategy:
Short-term intraday trading:
Long opportunities: Invest lightly on a pullback to the 3360-3355 area (support from the 4-hour middle line and the lower band of the daily triangle), with a stop-loss below 3345 and a target of 3377-3385. A breakout targets 3393-3410.
Aggressive buying: If the price stabilizes above 3367-3368, consider entering a long position directly, with a target of 3380-3390.
Be cautious with short positions: When the pressure zone of 3393-3410 is first touched, you can try short selling (which needs to be combined with a rapid rise and fall pattern), stop loss at 3415, and target at 3380-3370.
Mid-term strategy:
Primarily buy low: Strategize long positions between 3340-3330 (10-day moving average and triangle support) on the weekly chart, with a stop loss at 3310 and a target of 3460-3470 (upper weekly support). Breakout Follow-up: If the daily close stabilizes above 3410, add to long positions, targeting 3450-3470.
Key Points
Support:
Short-term: 3360-3355 (support from the middle track of the hourly/daily chart triangle)
Strong Support: 3340-3348 (10-day moving average and bullish resistance)
Resistance:
Short-term: 3377-3385 (extension from the non-farm payroll high)
Strong Resistance: 3393-3410 (support from the upper track of the daily chart and previous high)
Logical Analysis
Technical Analysis:
Weekly: A bullish candlestick with a long lower shadow confirms strong buying below 3340, with support from the middle track valid, indicating a bullish medium-term trend.
Daily: A large bullish candlestick breaks through the lower track of the converging triangle, with the MACD forming a golden cross. A break above 3360 would confirm a continuation of the bullish trend.
4-Hour: The moving averages are aligned in a bullish pattern, with 3350-3360 forming a platform support level. There is still upward momentum after a short-term correction.
Fundamentals:
Bullish Factors: Expectations of a September Fed rate cut (CME FedWatch shows a probability exceeding 70%) and geopolitical risks (Middle East/trade tensions) support safe-haven demand.
Negative risks: A short-term rebound in the US dollar (US dollar index resistance at 93.5) and a rise in US Treasury yields may suppress gold price gains.
Risk Warning: If the US dollar rebounds or US Treasury yields break through key resistance (such as 2.0% for the 10-year Treasury), gold could retreat to the 3330-3300 range.
Summary: In the short term, the main strategy for gold is to go long on pullbacks, with a focus on observing the effectiveness of the 3360 support level. A break above 3410 will open up greater space. Traders should flexibly adjust their positions based on data events and maintain strict stop-loss orders.
Trade closed: target reached
In-depth Analysis of the Latest Gold Market on August 5th:
I. Core Fundamentals
The Game of Bulls and Bears
Bullish Factors:
90% probability of a September Fed rate cut (weak non-farm payrolls reinforce easing expectations, suppressing the US dollar).
Escalating geopolitical risks (Middle East situation, trade frictions) stimulate safe-haven demand.
Technical Analysis: Weekly chart stabilizes (a long lower shadow bullish candlestick confirms support in the 3340-3350 area).
Bearish Pressure:
Short-term US dollar rebound (US Treasury yields rebound, gold under pressure).
High-level profit-taking pressure (3400-3450 is a historically strong resistance zone).
Key Events Outlook:
This week's focus: Fed officials' speeches and US CPI data (if inflation falls, expectations of a rate cut will rise again).
Risk Warning: If the US dollar rebounds or geopolitical tensions ease, gold may retest the 3300-3335 support level.
II. Technical Multi-Period Resonance Analysis
Weekly:
A bullish candlestick with a long lower shadow and holding above the middle band indicates a bullish medium-term trend, with a target of 3460-3470 (upper channel band).
Key support: 3340 (middle band); a break below would trigger a period of volatility; strong support at 3300 (the last line of defense for bulls).
Daily:
Converging triangle pattern: Lower support at 3345-3348 (10-day moving average), upper resistance at 3410.
After three attempts to break through 3450, the probability of a fourth attempt increases significantly, with a target of 3500+.
4-Hour Short-Term:
After the non-farm payroll report, the market has broken above the middle band, with 3356-3360 as the bull-bear watershed today.
MACD death cross correction, but rising lows (3345 → 3356), suggests a buildup of momentum for an upside move from above.
III. Today's Precision Trading Strategy
🎯 Main Strategy: Buy on pullbacks, supplemented by shorting at key resistance levels
Long Opportunities:
Conservative Level: Enter if it stabilizes at 3356-3360 (4-hour middle line), stop loss at 3345, target 3377-3385.
Aggressive Level: If the market stabilizes at 3368 during the European session, go long with a small position, stop loss at 3355, target 3393.
Short Opportunities:
Short on the first attempt to break through 3390-3400 (daily upper line), stop loss at 3410, target 3370.
Breakthrough Strategy:
If it breaks through 3385 with large volume, chase long positions and target 3400-3410, stop loss at 3375.
⚠️ Risk Management Tips:
Implement strict stop-loss orders! If it falls below 3356, temporarily avoid long positions and wait for support at 3340 before repositioning. If the US market rises and then falls, be wary of a "false breakout" and monitor whether 3368 can become support.
IV. Medium- to Long-Term Strategy Guidelines
Conditions for a Bull Market Trigger:
Weekly close above 3410, confirming a breakout from the converging triangle, with a target of 3500-3600.
The Fed's September rate cut, or escalating geopolitical crises, will accelerate the rise.
Risk Warning:
If the US dollar index rebounds above 106, gold may pull back to the 3250-3200 area.
Summary
Short-term: 3356-3360 is today's lifeline. If it holds, bulls will continue to squeeze, and if it falls below, it will turn into a volatile market.
Medium- to Long-term: The longer the sideways movement, the stronger the potential for a breakout. Patiently wait for a signal to break through 3450.
📌 Action Recommendation: Buy primarily during pullbacks to lower levels during the Asian and European sessions. Watch for momentum to break through 3385 during the US session and strictly follow the trend!
Related publications
Disclaimer
The information and publications are not meant to be, and do not constitute, financial, investment, trading, or other types of advice or recommendations supplied or endorsed by TradingView. Read more in the Terms of Use.
Related publications
Disclaimer
The information and publications are not meant to be, and do not constitute, financial, investment, trading, or other types of advice or recommendations supplied or endorsed by TradingView. Read more in the Terms of Use.