From a technical perspective, the recent breakdown below the 100-period Simple Moving Average (SMA) on the 4-hour chart was seen as a key trigger for the XAU/USD bears. Moreover, negative oscillators on the said chart suggest that any subsequent move up might still be seen as a selling opportunity and remain capped. However, a modest bounce from the $3,300 neighborhood, or a nearly three-week low touched on Monday, warrants some caution for bearish traders. Hence, it will be prudent to wait for a convincing break below the said handle before positioning for any further losses towards the $3,260-3,255 support, representing the 100-day SMA.
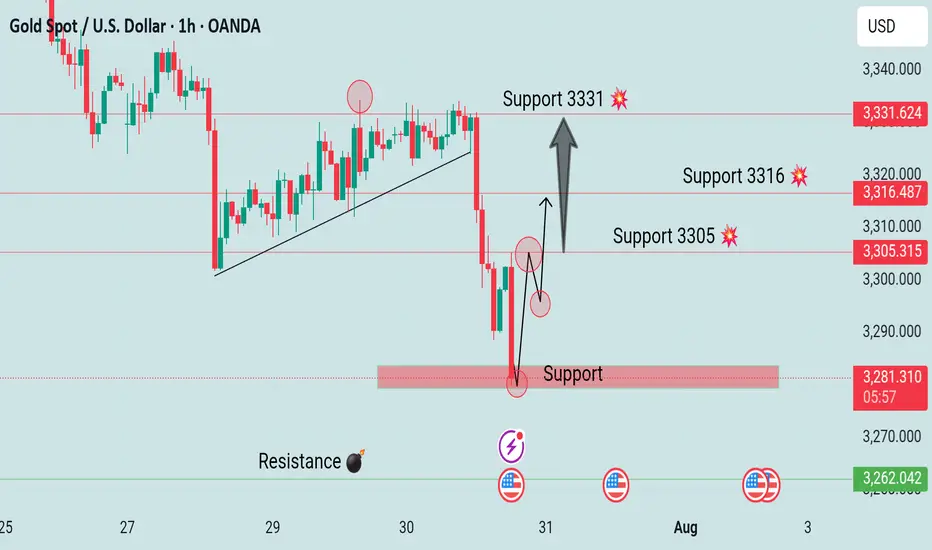
Xauusd buy 3283
Support 3305
Support 3316
Support 3331
Samll Support 3280
Resistance 3261
On the flip side, the $3,345 area (100-period SMA on the 4-hour chart) could act as an immediate hurdle, above which the Gold price could climb to the $3,367-3,368 region. A sustained strength beyond the latter might trigger a short-covering rally and allow the XAU/USD pair to reclaim the $3,400 round figure. The momentum could extend further, though it is likely to face a stiff hurdle near the $3,434-3,435 region. Some follow-through buying, however, would negate any near-term negative bias and pave the way for a move towards challenging the all-time peak, around the $3,500 psychological mark touched in April.
Trade active
Xauusd buy 100 pips runs 🏃♂️ Trade closed: target reached
Xauusd buy 140 pips runs 🏃♀️ Note
Xauusd buy 160 pips 🏃♂️ Note
Xauusd buy 200 pips running Note
Xauusd buy 230 pips running Note
Xauusd buy 300 pips running Note
Xauusd buy 330 pips running Disclaimer
The information and publications are not meant to be, and do not constitute, financial, investment, trading, or other types of advice or recommendations supplied or endorsed by TradingView. Read more in the Terms of Use.
Disclaimer
The information and publications are not meant to be, and do not constitute, financial, investment, trading, or other types of advice or recommendations supplied or endorsed by TradingView. Read more in the Terms of Use.