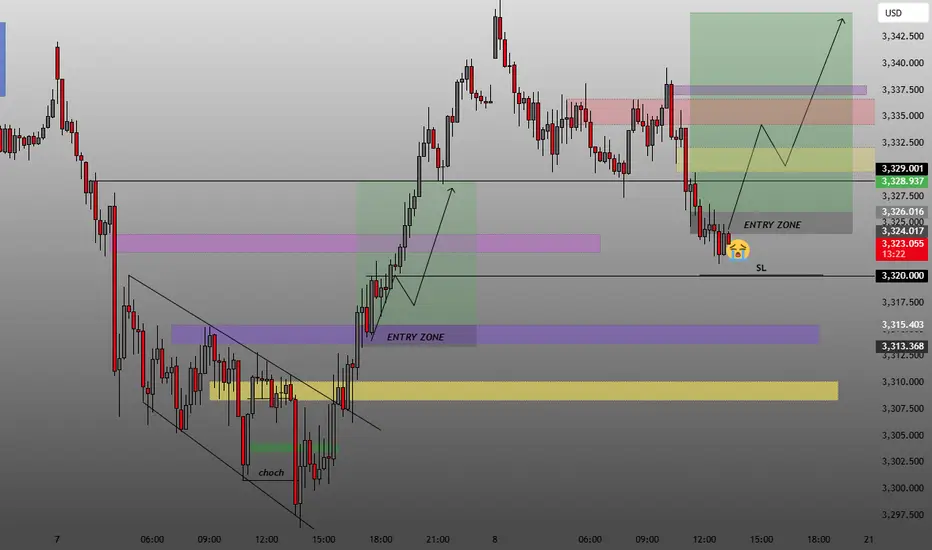
Current Price: Around 3,324 USD
Overall Setup: A bullish trade idea from a demand/entry zone
Chart Tools Used:
Rectangles/Zones indicating supply and demand
Text for notes like “ENTRY ZONE”, “choch” (change of character), and “SL” (stop-loss)
Arrows and paths illustrating expected price movement
Candlestick pattern with recent bullish activity
🔍 Key Elements:
1.
ENTRY ZONE (Current Focus):
Marked in gray at around 3,324 USD
A buy setup is suggested here, possibly based on price action and prior demand
A sad face emoji near the zone implies hesitation or a risky point for entry
2.
SL (Stop-Loss):
Placed just below the current price at approximately 3,320 USD
Indicates a tight risk margin
3.
TP Zone (Take Profit):
Large green area above entry zone (approximately 3,342–3,345 USD)
Indicates bullish target for the trade
4.
Change of Character (choch):
Marked below in green, indicating the first bullish break of structure after a downtrend
Confirming a shift in market direction
5.
Previous Zones:
Purple, yellow, green areas represent previous supply and demand levels
Entry was previously successful around 3,315–3,317 and 3,319
✅ Strategy Suggestion:
The trader is expecting:
A bullish bounce from the gray “ENTRY ZONE”
Possible retracement before moving toward take-profit zone
Setup follows Smart Money Concepts (SMC) or Supply & Demand logic
💰 King Maker FX — Master the Gold Market with Precision.
Unlock real-time trends, pro strategies, and expert insights to turn every move into profit. 🚀✨ t.me/kmforexllc
Unlock real-time trends, pro strategies, and expert insights to turn every move into profit. 🚀✨ t.me/kmforexllc
Disclaimer
The information and publications are not meant to be, and do not constitute, financial, investment, trading, or other types of advice or recommendations supplied or endorsed by TradingView. Read more in the Terms of Use.