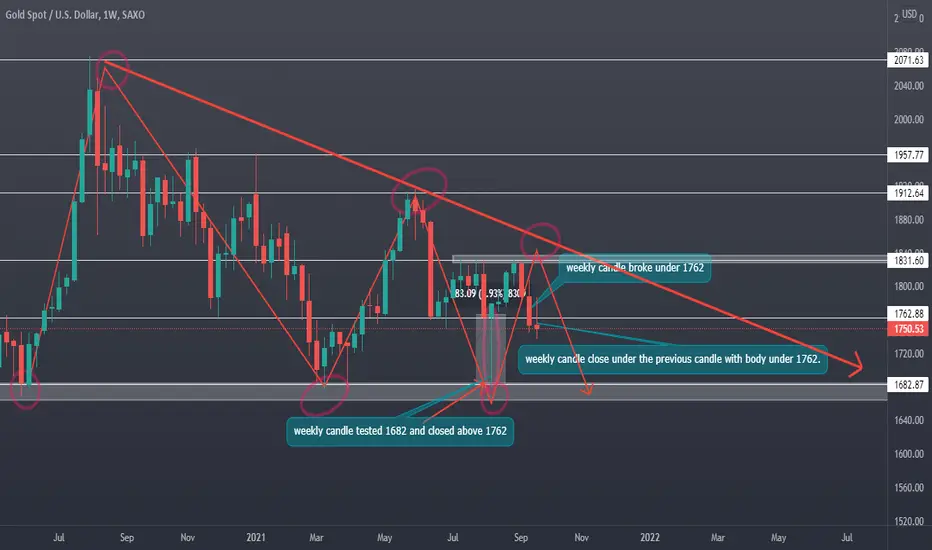
let's take a look at weekly candles , you can see that pin bar candle tested 1682 and closed above 1762 ( which make 1762 a strong support ). and since price kept printing bullish candles until reaching 1831.
price started his bearish movement from 1831 all the way down to 1761 again before breaking and closing under it , and forming a technical double top .
now from all this we can assume price will keep falling down and possibly coming back down to fill the weekly wick to 1682 .
what do you think ? comment your thought bellow .
Disclaimer
The information and publications are not meant to be, and do not constitute, financial, investment, trading, or other types of advice or recommendations supplied or endorsed by TradingView. Read more in the Terms of Use.
Disclaimer
The information and publications are not meant to be, and do not constitute, financial, investment, trading, or other types of advice or recommendations supplied or endorsed by TradingView. Read more in the Terms of Use.