In-depth analysis of the gold market: bear-dominated pattern under the resonance of risk aversion and technical aspects
I. News analysis: Multiple negative factors suppress gold prices
In the early Asian session on Monday (May 12), spot gold opened lower and hit a low of $3,265.88 per ounce, down nearly $60 (1.76%) from the closing price last Friday, hitting a new low in the past week. The change in market sentiment is mainly affected by the following factors:
Breakthrough in China-US trade negotiations
Last weekend, senior Chinese and US economic and trade officials held talks in Geneva, Switzerland, and issued a joint statement. Both sides agreed to reduce tariffs to the 10% benchmark level. Market risk appetite rebounded sharply and gold safe-haven demand dropped sharply.
Around 15:00, gold crashed in the short term, plummeting by $19 in 1 minute, reflecting the market's strong reaction to the easing of the trade situation.
Geopolitical risks cool down
Russian President Putin proposed to resume direct negotiations between Russia and Ukraine in Turkey on May 15, and market concerns about the escalation of the conflict have eased.
The news of ceasefire between India and Pakistan further weakened the risk aversion sentiment, and the confidence of gold bulls was frustrated.
2. Technical analysis: short trend strengthened
1. Weekly level: Second peak failed, pay attention to the break of moving average
Last week, the medium-sized positive line with a long upper shadow line was closed, and the secondary high point of $3435 was formed, indicating that the bulls lacked momentum.
The price has now fallen below the 5-week moving average (near 3250). If it cannot be recovered this week, it may further fall to the 10-week moving average (3186), and even test the support of the middle track of $3000.
2. Daily level: shock biased to the short side, MACD dead cross confirmed
The Bollinger band closed and flattened, the price ran below the middle track, and the short-term moving average (5 days, 10 days) turned downward, indicating that the bears were dominant.
MACD high dead cross, red column shrinking, technical support for further callback
Key resistance: 3250-3260 (10-day moving average & Bollinger middle rail)
Key support: 3200 (Bollinger lower rail)
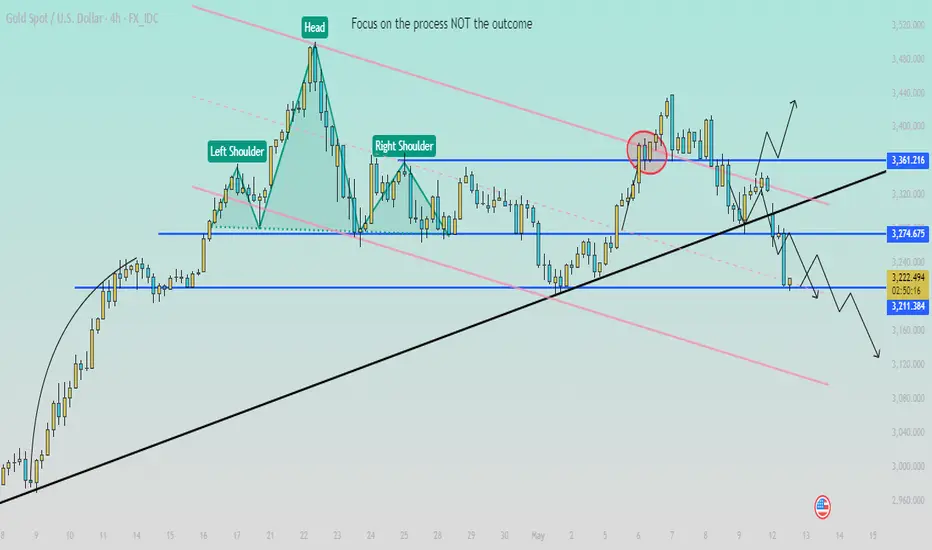
3. 4-hour & 1-hour level: short-term short positions, gap filling pressure
The 4-hour chart shows a step-by-step downward trend, MA5 and MA10 cross below 66MA, MACD green column volume, and strong short-term momentum.
The 1-hour level gap is large, the short-term rebound is weak, and it is expected that the filling will need to wait for subsequent adjustments.
3. Operation strategy: rebound high and empty, cautious low long
Short order strategy:
Entry point: 3240-3250 (10-day moving average & middle rail resistance)
Stop loss: above 3260
Target: 3200-3190 (see 3150 if it breaks down)
Multiple order strategy (short-term):
If the 3200 support is effective, you can lightly position to rebound, target 3230, stop loss 3185.
IV. Risk Warning
Federal Reserve Policy Trends: This week, we need to pay attention to the speeches of Fed officials. If dovish signals are released, the decline of gold prices may be limited.
Geopolitical situation is fluctuating: If there are new variables in the Russian-Ukrainian negotiations, it may trigger the return of safe-haven buying.
Conclusion
Gold is currently under the dual influence of the decline of risk aversion sentiment and the technical short-term pressure, and the short-term trend is bearish. In terms of operation, it is recommended to mainly short on rebound. If the key support of 3200 is lost, it may open up greater downward space. Investors need to pay close attention to the subsequent progress of Sino-US trade and geopolitical dynamics, and adjust their strategies flexibly.
Disclaimer
The information and publications are not meant to be, and do not constitute, financial, investment, trading, or other types of advice or recommendations supplied or endorsed by TradingView. Read more in the Terms of Use.
Disclaimer
The information and publications are not meant to be, and do not constitute, financial, investment, trading, or other types of advice or recommendations supplied or endorsed by TradingView. Read more in the Terms of Use.