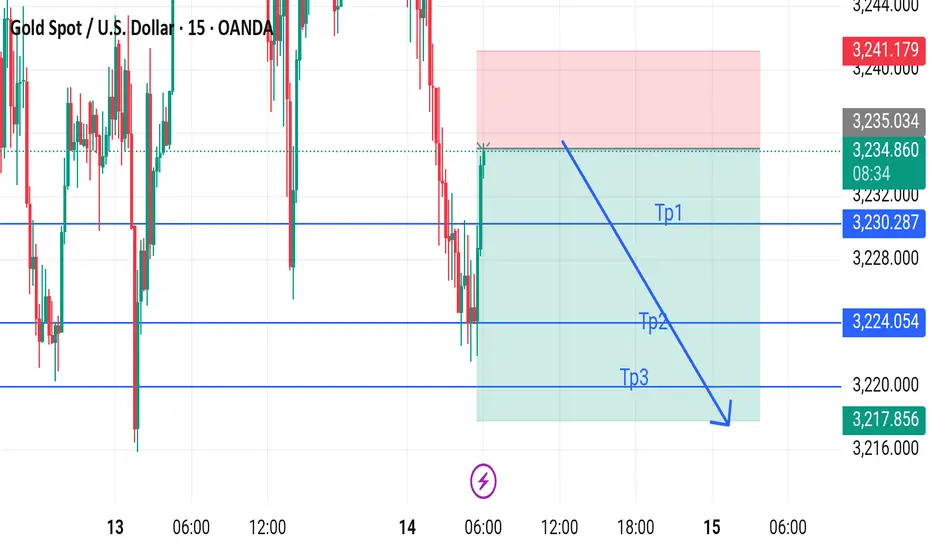
This is a 15-minute chart of XAUUSD (Gold vs. USD) with a short (sell) trade setup. Here's a breakdown of what the chart shows:
Entry Point: Around 3,235.320
Stop Loss (Red Zone): Approximately 3,241.179
Take Profit Levels:
TP1: 3,230.287
TP2: 3,224.054
TP3: 3,217.856
Trade Bias: Bearish (downward arrow suggests expectation of a price drop)
Risk-Reward: Good risk-to-reward ratio, with the take profits staggered to secure partial profits as the trade moves in your favor.
The current candle seems bullish, so price may be testing the resistance before potentially reversing. If it fails to break the resistance (around the stop loss area), it could validate the short setup.
Would you like a technical analysis or help setting up alerts for these levels?
Disclaimer
The information and publications are not meant to be, and do not constitute, financial, investment, trading, or other types of advice or recommendations supplied or endorsed by TradingView. Read more in the Terms of Use.
Disclaimer
The information and publications are not meant to be, and do not constitute, financial, investment, trading, or other types of advice or recommendations supplied or endorsed by TradingView. Read more in the Terms of Use.