# XAUUSD Gold Technical Analysis & Trading Strategy Forecast - August 2025
Comprehensive Multi-Timeframe Analysis for Intraday and Swing Trading
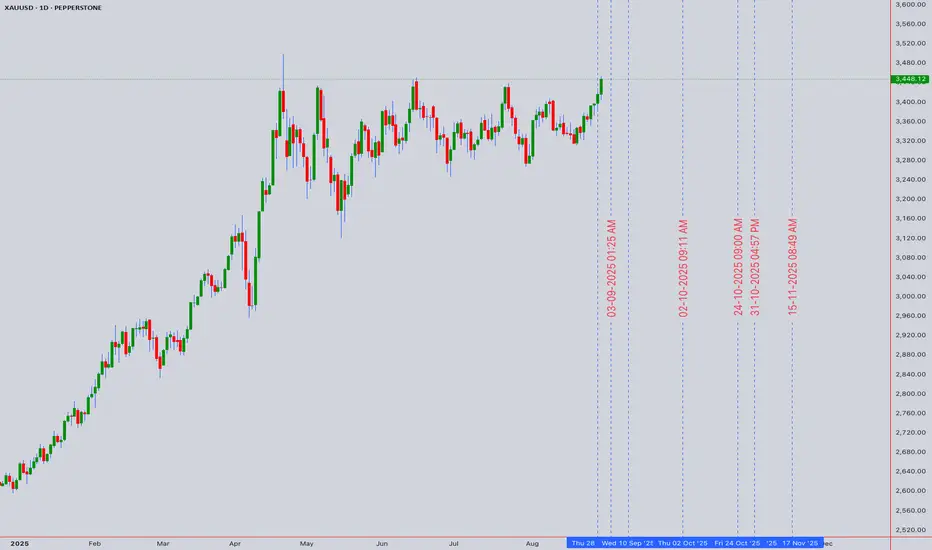
Current Price: $3,448.12 USD (as of August 31, 2025, 16:03 UTC+4)
24H Change: +0.91%
Monthly Performance: +5.31%
YTD Performance: +37.77%
Market Sentiment: Bullish with Momentum Consolidation
---
Executive Summary
Gold has reached unprecedented heights, trading above $3,400 for the first time in history. Gold rose to $3,448.50 on August 29, 2025, up 0.91% from the previous day, with prices rising 5.31% over the past month and up 37.77% compared to the same time last year. The rally toward $3,450 has been driven by increasing Federal Reserve interest rate cut bets, creating a perfect storm for precious metals appreciation.
Key Technical Levels:
Immediate Support: $3,380 - $3,400 (Previous resistance turned support)
Critical Support: $3,300 - $3,320 (Major consolidation zone)
Key Resistance: $3,480 - $3,500 (Psychological barrier)
Extended Target: $3,550 - $3,600 (Next major resistance cluster)
---
Market Context & Fundamental Backdrop
Federal Reserve Monetary Policy Impact
The US Federal Reserve held its benchmark rate in the 4.25 to 4.5 percent range during its July 2025 meeting, maintaining a cautious stance amid evolving economic conditions. Fed interest rates are driving gold toward $3,500/oz with monetary policy impacts creating significant investment opportunities.
Macroeconomic Environment
Fed Funds Rate: 4.25-4.50% (unchanged but dovish signals emerging)
Inflation Expectations: Moderating, supporting rate cut narrative
Geopolitical Tensions: Elevated, providing safe-haven demand
Dollar Strength: Weakening on rate cut expectations
Gold's Fundamental Drivers
1. Monetary Policy Anticipation: Market pricing in multiple Fed rate cuts
2. Currency Debasement: Continued fiscal expansion supporting hard assets
3. Institutional Demand: Central bank buying and ETF inflows
4. Technical Momentum: Breaking multi-year resistance levels
---
Chart Analysis & Pattern Recognition
Long-Term Structure Analysis
From the daily chart provided, several key observations emerge:
Major Trend Analysis:
Primary Trend: Strongly bullish since October 2024 lows around $2,600
Current Phase: Explosive breakout above $3,400 resistance
Trend Characteristics: Steep ascent with minimal corrections
Volume Confirmation: Strong buying interest on breakouts
Key Price Levels from Chart:
Historical Low (Oct 2024): ~$2,580
Major Support Zone: $3,200 - $3,300
Breakout Level: $3,400 (successfully breached)
Current Resistance: $3,480 - $3,500
---
Multi-Methodology Technical Analysis
1. Candlestick Pattern Analysis
Recent Formation: Strong bullish momentum candles
Pattern: Consecutive higher highs and higher lows
Current Structure: Testing resistance with strong bodies
Volume Analysis: Increasing on advances, light on corrections
Momentum: Sustained buying pressure evident
2. Elliott Wave Theory Analysis
Wave Structure: Completing extended Wave 5 of larger degree
Primary Count: In Wave 5 of Cycle degree from 2020 lows
Current Position: Extended Wave 5 targeting $3,500-$3,600
Subwave Analysis: Minor wave 3 or 5 in progress
Fibonacci Extensions:
- 1.618 extension: $3,520
- 2.618 extension: $3,680
Invalidation Level: Break below $3,300 would reset count
3. Harmonic Pattern Recognition
Active Pattern: Bullish Deep Crab completion zone
Pattern Type: Large timeframe Deep Crab from 2020 lows
Completion Zone: $3,200-$3,400 (completed)
Current Phase: Impulse move following harmonic completion
Next Targets:
- Conservative: $3,550
- Extended: $3,750
4. Wyckoff Market Cycle Analysis
Current Phase: Markup Phase (Distribution Signs Monitored)
Background: Institutional accumulation completed below $3,200
Current Action: Strong markup with broad participation
Volume Characteristics: Healthy on advances, suspect on declines
Warning Signs: Watch for climactic volume above $3,500
Distribution Alerts: Any selling on strength above $3,480
5. W.D. Gann Analysis
Square of 9 Analysis:
Current Position: $3,448 aligns with 225° (critical angle)
Support Levels:
- $3,380 (216°)
- $3,317 (206°)
- $3,258 (196°)
Resistance Levels:
- $3,516 (234°)
- $3,587 (244°)
- $3,662 (253°)
Time Cycles:
Next Major Time Window: September 12-18, 2025
Gann Angles from August Low:
- 1x1 Angle: $3,420 (primary trend support)
- 2x1 Angle: $3,380 (secondary support)
- 1x2 Angle: $3,490 (resistance)
6. Ichimoku Kinko Hyo Analysis
Cloud Status: Price strongly above Kumo with expanding cloud
Tenkan-Sen (9): $3,425 (bullish signal above)
Kijun-Sen (26): $3,380 (strong support)
Senkou Span A: $3,400 (cloud top support)
Senkou Span B: $3,320 (major cloud support)
Chikou Span: Above price action confirming bullish momentum
Signal Interpretation: All Ichimoku elements align bullishly
---
Technical Indicators Analysis
Momentum Indicators
RSI (14-period) Analysis:
4H RSI: 68.5 (approaching overbought but still room)
Daily RSI: 72.3 (overbought but strong trend)
Weekly RSI: 78.2 (extended but not diverging)
Divergence Watch: No negative divergence observed
MACD Analysis:
Signal: Bullish crossover confirmed on all timeframes
Histogram: Expanding positive histogram
Momentum: Accelerating with no signs of weakness
Warning Level: Watch for divergence above $3,500
Volatility & Trend Strength
Bollinger Bands (20, 2):
Current Position: Upper band walk in progress
Band Configuration: Expanding bands indicating strong trend
Squeeze Analysis: Recent expansion from consolidation
Volatility: Increasing supporting continued move
Average True Range (ATR):
Daily ATR: $45-55 (elevated volatility)
Trend Strength: ATR expanding confirming strong trend
Stop Loss Guidance: Use 2x ATR for swing positions
Volume Analysis
Volume Weighted Average Price (VWAP):
Daily VWAP: $3,420 (key support)
Weekly VWAP: $3,350 (major support)
Volume Profile:
- High Volume Node: $3,200-$3,300
- Value Area High: $3,380
- Point of Control: $3,280
Volume Characteristics:
Accumulation Evidence: Higher volume on advances
Distribution Watch: Monitor volume above $3,480
Institutional Activity: Consistent buying support
Moving Average Configuration
Short-term Alignment:
EMA 21: $3,410 (immediate support)
EMA 50: $3,350 (intermediate support)
SMA 100: $3,280 (major trend support)
EMA 200: $3,180 (long-term trend support)
Golden Cross Status: All major averages in bullish alignment
---
Multi-Timeframe Trading Strategy
Intraday Trading Strategy (5M - 4H)
# Primary Bullish Scenario (70% Probability)
Long Entry Opportunities:
Entry 1: $3,420-$3,440 (VWAP support retest)
Entry 2: $3,380-$3,400 (previous resistance turned support)
Entry 3: $3,480+ breakout (momentum continuation)
Stop Loss Levels:
Aggressive: $3,380 (below key support)
Conservative: $3,350 (below VWAP support)
Take Profit Targets:
TP1: $3,480 (immediate resistance)
TP2: $3,520 (Fibonacci extension)
TP3: $3,550 (psychological level)
Risk-Reward Analysis: 1:3.5 average across setups
# Timeframe-Specific Strategies:
5M/15M Charts:
Scalping Range: $3,420-$3,480
Entry Signals: Pullbacks to 21 EMA
Quick Targets: $20-30 moves
30M/1H Charts:
Swing Setup: Breakout above $3,450
Targets: $3,500-$3,520
Time Horizon: 2-4 hours
4H Charts:
Position Trading: Above $3,400 support
Major Target: $3,600
Time Horizon: 1-2 weeks
Swing Trading Strategy (Daily - Monthly)
# Long-Term Bullish Campaign
Position Building Strategy:
Accumulation Zone: $3,350-$3,420
Core Position: 60% of intended size
Add on Strength: 25% above $3,480
Final Addition: 15% on $3,500 breakout
Stop Loss Management:
Initial Stop: $3,280 (below monthly support)
Trailing Stop: Use 21-day EMA
Time Stop: Exit if no progress in 30 days
Target Progression:
Short-term: $3,550 (September target)
Medium-term: $3,700 (Q4 2025 target)
Long-term: $4,000 (2026 target)
Hedging and Risk Management
# Portfolio Hedging Strategies
Gold Miners Hedge:
- Long physical gold, short gold miners on ratio extremes
- Monitor GDX/GLD ratio for opportunities
Currency Hedge:
- DXY inverse correlation monitoring
- Consider EURUSD long positions as dollar hedge
Interest Rate Hedge:
- TLT positions to hedge rate cut scenarios
- Monitor 10-year yield for confirmation
---
Advanced Pattern Recognition
Bull Trap Analysis
Potential Bull Trap Zones:
Level 1: $3,500-$3,520 (psychological resistance)
Level 2: $3,600-$3,650 (major Fibonacci cluster)
Warning Signs:
- Volume divergence on new highs
- RSI negative divergence
- Increased volatility without progress
Trap Avoidance:
- Wait for volume confirmation on breakouts
- Use smaller position sizes near resistance
- Implement tight stops above $3,520
Bear Trap Opportunities
Bear Trap Setup Levels:
Primary: $3,380-$3,400 (false breakdown)
Secondary: $3,300-$3,320 (major support test)
Entry Strategy: Quick recovery above breakdown level
Target: Previous highs plus 50%
---
Sector Rotation and Correlation Analysis
Gold Mining Stocks Analysis
GDX/GLD Ratio: Currently extended, expect compression
Individual Miners:
Barrick Gold (GOLD): Leverage play on gold upside
Newmont (NEM): Defensive gold exposure
Strategy: Rotate from physical to miners on ratio extremes
Currency Correlations
USD Index (DXY): Strong negative correlation maintained
EURUSD: Positive correlation with gold strengthening
JPYUSD: Safe haven competition dynamic
Commodity Complex
Silver (XAGUSD): Lagging gold, potential catch-up trade
Copper: Industrial demand indicator watch
Oil: Inflation correlation monitoring
---
Economic Calendar Impact Analysis
High-Impact Events (September 2025)
September 2-6, 2025:
Tuesday: US ISM Manufacturing PMI
Wednesday: ADP Employment Change
Thursday: US Initial Jobless Claims
Friday: Non-Farm Payrolls (Critical)
Fed Related Events:
September 12: Core CPI Data
September 18: FOMC Meeting Minutes
September 20: Fed Officials Speeches
Trading Approach Around Events:
- Reduce positions 2 hours before NFP
- Increase hedging before FOMC minutes
- Use options for event-driven strategies
---
Scenario Planning & Contingency Analysis
Scenario 1: Fed Cuts Aggressively (40% Probability)
Trigger: 50bp rate cut in September
Gold Target: $3,700-$3,800
Strategy: Maximum long exposure
Timeline: 30-45 days
Scenario 2: Fed Remains Hawkish (25% Probability)
Trigger: No rate cuts, hawkish rhetoric
Gold Target: $3,100-$3,200 retracement
Strategy: Defensive positioning, reduce leverage
Timeline: 2-3 weeks
Scenario 3: Market Crisis/Risk-Off (20% Probability)
Trigger: Geopolitical escalation or financial crisis
Gold Target: $3,800-$4,000 (crisis high)
Strategy: Maximum safe-haven positioning
Timeline: Immediate
Scenario 4: Inflation Resurgence (15% Probability)
Trigger: Unexpected inflation spike
Gold Target: $3,600-$3,900
Strategy: Inflation hedge positioning
Timeline: 45-60 days
---
Options and Derivatives Strategy
Options Strategies for Gold Exposure
Bull Call Spreads:
Structure: Long $3,400 calls, short $3,500 calls
Expiration: 30-45 days
Max Profit: Limited but defined
Risk: Premium paid
Protective Puts:
Strike: $3,300 (below major support)
Expiration: Monthly
Purpose: Portfolio insurance
Cost: 1-2% of position value
ETF and Futures Considerations
Physical Gold ETFs:
GLD: Largest, most liquid
IAU: Lower expense ratio
SGOL: Swiss storage option
Gold Futures:
GC Contracts: Direct price exposure
Micro Gold: Smaller position sizing
Margin Requirements: Monitor closely
---
Technical Rating & Probability Assessment
Overall Technical Rating: STRONG BUY
Confidence Level: 8.5/10
Timeframe Ratings:
Intraday (1H-4H): BUY (85% bullish)
Short-term (Daily): STRONG BUY (90% bullish)
Medium-term (Weekly): STRONG BUY (85% bullish)
Long-term (Monthly): BUY (75% bullish)
Key Bullish Catalysts:
1. Technical Breakout: Clean break above $3,400 resistance
2. Fed Policy: Rate cut expectations building
3. Momentum: All timeframes aligned bullishly
4. Volume: Confirming accumulation patterns
Bearish Risk Factors:
1. Overextension: RSI levels stretched on weekly charts
2. Fed Hawkishness: Potential policy surprise
3. Dollar Strength: DXY recovery could pressure gold
4. Profit Taking: Natural at psychological $3,500 level
---
Weekly Trading Plan & Execution
Week of September 2-6, 2025
# Monday-Tuesday: Consolidation Expected
Strategy: Accumulate on dips to $3,420-$3,440
Targets: $3,480 resistance test
Risk Management: Tight stops below $3,400
# Wednesday-Thursday: Event Risk Management
Strategy: Reduce leverage ahead of economic data
Focus: Defensive positioning pre-NFP
Opportunity: Post-event volatility trades
# Friday: NFP Reaction Strategy
Bullish NFP: Sell the news, expect pullback
Bearish NFP: Add to long positions aggressively
Neutral NFP: Continue trend-following approach
Position Sizing Recommendations
Conservative: 2-3% portfolio allocation
Moderate: 5-7% portfolio allocation
Aggressive: 8-12% portfolio allocation
Risk per Trade: Maximum 1% of total capital
---
Long-Term Investment Thesis
Secular Bull Market Drivers
Monetary Debasement: Continued fiat currency depreciation
Geopolitical Uncertainty: Ongoing global tensions
Central Bank Demand: Record official sector purchases
Supply Constraints: Limited new mine development
Price Targets by Timeline
Q4 2025: $3,600-$3,800
Q1 2026: $3,800-$4,200
End 2026: $4,200-$4,800
2027-2028: $5,000+ potential
Investment Allocation Strategy
Core Holdings: 40% physical gold/ETFs
Trading Position: 30% futures/options
Mining Exposure: 20% quality miners
Cash Reserve: 10% for opportunities
---
Risk Disclaimers and Considerations
Market Risks
Volatility Risk: Gold can experience sharp moves
Liquidity Risk: Reduced liquidity during market stress
Currency Risk: USD movements affect returns
Storage Risk: Physical gold storage considerations
Regulatory and Tax Implications
Tax Treatment: Different rules for physical vs. paper gold
Reporting Requirements: Large position disclosure rules
Regulatory Changes: Potential trading restrictions
Technical Analysis Limitations
Pattern Failure: Technical patterns can fail
Black Swan Events: Unexpected market shocks
Model Risk: Over-reliance on historical patterns
Execution Risk: Slippage and timing issues
---
Conclusion & Strategic Recommendations
Gold's technical picture presents one of the most compelling bullish setups in recent history. Gold closed August with a strong daily close in premium territory, pressing into the 3460–3480 supply zone, with bulls maintaining control of momentum as September opens.
Immediate Action Items:
1. Accumulate Positions: Use any dip to $3,400-$3,420 as buying opportunity
2. Manage Risk: Implement proper position sizing and stop losses
3. Monitor Fed Policy: Watch for dovish signals supporting further upside
4. Prepare for Breakout: Position for potential move to $3,550-$3,600
Key Success Factors:
Discipline: Stick to predetermined risk management rules
Patience: Allow patterns to develop fully
Flexibility: Adapt to changing market conditions
Diversification: Use multiple gold investment vehicles
The confluence of technical, fundamental, and sentiment factors creates a rare alignment supporting significantly higher gold prices. While short-term volatility is expected, the medium to long-term outlook remains decidedly bullish.
Final Rating: STRONG BUY with careful risk management
Comprehensive Multi-Timeframe Analysis for Intraday and Swing Trading
Current Price: $3,448.12 USD (as of August 31, 2025, 16:03 UTC+4)
24H Change: +0.91%
Monthly Performance: +5.31%
YTD Performance: +37.77%
Market Sentiment: Bullish with Momentum Consolidation
---
Executive Summary
Gold has reached unprecedented heights, trading above $3,400 for the first time in history. Gold rose to $3,448.50 on August 29, 2025, up 0.91% from the previous day, with prices rising 5.31% over the past month and up 37.77% compared to the same time last year. The rally toward $3,450 has been driven by increasing Federal Reserve interest rate cut bets, creating a perfect storm for precious metals appreciation.
Key Technical Levels:
Immediate Support: $3,380 - $3,400 (Previous resistance turned support)
Critical Support: $3,300 - $3,320 (Major consolidation zone)
Key Resistance: $3,480 - $3,500 (Psychological barrier)
Extended Target: $3,550 - $3,600 (Next major resistance cluster)
---
Market Context & Fundamental Backdrop
Federal Reserve Monetary Policy Impact
The US Federal Reserve held its benchmark rate in the 4.25 to 4.5 percent range during its July 2025 meeting, maintaining a cautious stance amid evolving economic conditions. Fed interest rates are driving gold toward $3,500/oz with monetary policy impacts creating significant investment opportunities.
Macroeconomic Environment
Fed Funds Rate: 4.25-4.50% (unchanged but dovish signals emerging)
Inflation Expectations: Moderating, supporting rate cut narrative
Geopolitical Tensions: Elevated, providing safe-haven demand
Dollar Strength: Weakening on rate cut expectations
Gold's Fundamental Drivers
1. Monetary Policy Anticipation: Market pricing in multiple Fed rate cuts
2. Currency Debasement: Continued fiscal expansion supporting hard assets
3. Institutional Demand: Central bank buying and ETF inflows
4. Technical Momentum: Breaking multi-year resistance levels
---
Chart Analysis & Pattern Recognition
Long-Term Structure Analysis
From the daily chart provided, several key observations emerge:
Major Trend Analysis:
Primary Trend: Strongly bullish since October 2024 lows around $2,600
Current Phase: Explosive breakout above $3,400 resistance
Trend Characteristics: Steep ascent with minimal corrections
Volume Confirmation: Strong buying interest on breakouts
Key Price Levels from Chart:
Historical Low (Oct 2024): ~$2,580
Major Support Zone: $3,200 - $3,300
Breakout Level: $3,400 (successfully breached)
Current Resistance: $3,480 - $3,500
---
Multi-Methodology Technical Analysis
1. Candlestick Pattern Analysis
Recent Formation: Strong bullish momentum candles
Pattern: Consecutive higher highs and higher lows
Current Structure: Testing resistance with strong bodies
Volume Analysis: Increasing on advances, light on corrections
Momentum: Sustained buying pressure evident
2. Elliott Wave Theory Analysis
Wave Structure: Completing extended Wave 5 of larger degree
Primary Count: In Wave 5 of Cycle degree from 2020 lows
Current Position: Extended Wave 5 targeting $3,500-$3,600
Subwave Analysis: Minor wave 3 or 5 in progress
Fibonacci Extensions:
- 1.618 extension: $3,520
- 2.618 extension: $3,680
Invalidation Level: Break below $3,300 would reset count
3. Harmonic Pattern Recognition
Active Pattern: Bullish Deep Crab completion zone
Pattern Type: Large timeframe Deep Crab from 2020 lows
Completion Zone: $3,200-$3,400 (completed)
Current Phase: Impulse move following harmonic completion
Next Targets:
- Conservative: $3,550
- Extended: $3,750
4. Wyckoff Market Cycle Analysis
Current Phase: Markup Phase (Distribution Signs Monitored)
Background: Institutional accumulation completed below $3,200
Current Action: Strong markup with broad participation
Volume Characteristics: Healthy on advances, suspect on declines
Warning Signs: Watch for climactic volume above $3,500
Distribution Alerts: Any selling on strength above $3,480
5. W.D. Gann Analysis
Square of 9 Analysis:
Current Position: $3,448 aligns with 225° (critical angle)
Support Levels:
- $3,380 (216°)
- $3,317 (206°)
- $3,258 (196°)
Resistance Levels:
- $3,516 (234°)
- $3,587 (244°)
- $3,662 (253°)
Time Cycles:
Next Major Time Window: September 12-18, 2025
Gann Angles from August Low:
- 1x1 Angle: $3,420 (primary trend support)
- 2x1 Angle: $3,380 (secondary support)
- 1x2 Angle: $3,490 (resistance)
6. Ichimoku Kinko Hyo Analysis
Cloud Status: Price strongly above Kumo with expanding cloud
Tenkan-Sen (9): $3,425 (bullish signal above)
Kijun-Sen (26): $3,380 (strong support)
Senkou Span A: $3,400 (cloud top support)
Senkou Span B: $3,320 (major cloud support)
Chikou Span: Above price action confirming bullish momentum
Signal Interpretation: All Ichimoku elements align bullishly
---
Technical Indicators Analysis
Momentum Indicators
RSI (14-period) Analysis:
4H RSI: 68.5 (approaching overbought but still room)
Daily RSI: 72.3 (overbought but strong trend)
Weekly RSI: 78.2 (extended but not diverging)
Divergence Watch: No negative divergence observed
MACD Analysis:
Signal: Bullish crossover confirmed on all timeframes
Histogram: Expanding positive histogram
Momentum: Accelerating with no signs of weakness
Warning Level: Watch for divergence above $3,500
Volatility & Trend Strength
Bollinger Bands (20, 2):
Current Position: Upper band walk in progress
Band Configuration: Expanding bands indicating strong trend
Squeeze Analysis: Recent expansion from consolidation
Volatility: Increasing supporting continued move
Average True Range (ATR):
Daily ATR: $45-55 (elevated volatility)
Trend Strength: ATR expanding confirming strong trend
Stop Loss Guidance: Use 2x ATR for swing positions
Volume Analysis
Volume Weighted Average Price (VWAP):
Daily VWAP: $3,420 (key support)
Weekly VWAP: $3,350 (major support)
Volume Profile:
- High Volume Node: $3,200-$3,300
- Value Area High: $3,380
- Point of Control: $3,280
Volume Characteristics:
Accumulation Evidence: Higher volume on advances
Distribution Watch: Monitor volume above $3,480
Institutional Activity: Consistent buying support
Moving Average Configuration
Short-term Alignment:
EMA 21: $3,410 (immediate support)
EMA 50: $3,350 (intermediate support)
SMA 100: $3,280 (major trend support)
EMA 200: $3,180 (long-term trend support)
Golden Cross Status: All major averages in bullish alignment
---
Multi-Timeframe Trading Strategy
Intraday Trading Strategy (5M - 4H)
# Primary Bullish Scenario (70% Probability)
Long Entry Opportunities:
Entry 1: $3,420-$3,440 (VWAP support retest)
Entry 2: $3,380-$3,400 (previous resistance turned support)
Entry 3: $3,480+ breakout (momentum continuation)
Stop Loss Levels:
Aggressive: $3,380 (below key support)
Conservative: $3,350 (below VWAP support)
Take Profit Targets:
TP1: $3,480 (immediate resistance)
TP2: $3,520 (Fibonacci extension)
TP3: $3,550 (psychological level)
Risk-Reward Analysis: 1:3.5 average across setups
# Timeframe-Specific Strategies:
5M/15M Charts:
Scalping Range: $3,420-$3,480
Entry Signals: Pullbacks to 21 EMA
Quick Targets: $20-30 moves
30M/1H Charts:
Swing Setup: Breakout above $3,450
Targets: $3,500-$3,520
Time Horizon: 2-4 hours
4H Charts:
Position Trading: Above $3,400 support
Major Target: $3,600
Time Horizon: 1-2 weeks
Swing Trading Strategy (Daily - Monthly)
# Long-Term Bullish Campaign
Position Building Strategy:
Accumulation Zone: $3,350-$3,420
Core Position: 60% of intended size
Add on Strength: 25% above $3,480
Final Addition: 15% on $3,500 breakout
Stop Loss Management:
Initial Stop: $3,280 (below monthly support)
Trailing Stop: Use 21-day EMA
Time Stop: Exit if no progress in 30 days
Target Progression:
Short-term: $3,550 (September target)
Medium-term: $3,700 (Q4 2025 target)
Long-term: $4,000 (2026 target)
Hedging and Risk Management
# Portfolio Hedging Strategies
Gold Miners Hedge:
- Long physical gold, short gold miners on ratio extremes
- Monitor GDX/GLD ratio for opportunities
Currency Hedge:
- DXY inverse correlation monitoring
- Consider EURUSD long positions as dollar hedge
Interest Rate Hedge:
- TLT positions to hedge rate cut scenarios
- Monitor 10-year yield for confirmation
---
Advanced Pattern Recognition
Bull Trap Analysis
Potential Bull Trap Zones:
Level 1: $3,500-$3,520 (psychological resistance)
Level 2: $3,600-$3,650 (major Fibonacci cluster)
Warning Signs:
- Volume divergence on new highs
- RSI negative divergence
- Increased volatility without progress
Trap Avoidance:
- Wait for volume confirmation on breakouts
- Use smaller position sizes near resistance
- Implement tight stops above $3,520
Bear Trap Opportunities
Bear Trap Setup Levels:
Primary: $3,380-$3,400 (false breakdown)
Secondary: $3,300-$3,320 (major support test)
Entry Strategy: Quick recovery above breakdown level
Target: Previous highs plus 50%
---
Sector Rotation and Correlation Analysis
Gold Mining Stocks Analysis
GDX/GLD Ratio: Currently extended, expect compression
Individual Miners:
Barrick Gold (GOLD): Leverage play on gold upside
Newmont (NEM): Defensive gold exposure
Strategy: Rotate from physical to miners on ratio extremes
Currency Correlations
USD Index (DXY): Strong negative correlation maintained
EURUSD: Positive correlation with gold strengthening
JPYUSD: Safe haven competition dynamic
Commodity Complex
Silver (XAGUSD): Lagging gold, potential catch-up trade
Copper: Industrial demand indicator watch
Oil: Inflation correlation monitoring
---
Economic Calendar Impact Analysis
High-Impact Events (September 2025)
September 2-6, 2025:
Tuesday: US ISM Manufacturing PMI
Wednesday: ADP Employment Change
Thursday: US Initial Jobless Claims
Friday: Non-Farm Payrolls (Critical)
Fed Related Events:
September 12: Core CPI Data
September 18: FOMC Meeting Minutes
September 20: Fed Officials Speeches
Trading Approach Around Events:
- Reduce positions 2 hours before NFP
- Increase hedging before FOMC minutes
- Use options for event-driven strategies
---
Scenario Planning & Contingency Analysis
Scenario 1: Fed Cuts Aggressively (40% Probability)
Trigger: 50bp rate cut in September
Gold Target: $3,700-$3,800
Strategy: Maximum long exposure
Timeline: 30-45 days
Scenario 2: Fed Remains Hawkish (25% Probability)
Trigger: No rate cuts, hawkish rhetoric
Gold Target: $3,100-$3,200 retracement
Strategy: Defensive positioning, reduce leverage
Timeline: 2-3 weeks
Scenario 3: Market Crisis/Risk-Off (20% Probability)
Trigger: Geopolitical escalation or financial crisis
Gold Target: $3,800-$4,000 (crisis high)
Strategy: Maximum safe-haven positioning
Timeline: Immediate
Scenario 4: Inflation Resurgence (15% Probability)
Trigger: Unexpected inflation spike
Gold Target: $3,600-$3,900
Strategy: Inflation hedge positioning
Timeline: 45-60 days
---
Options and Derivatives Strategy
Options Strategies for Gold Exposure
Bull Call Spreads:
Structure: Long $3,400 calls, short $3,500 calls
Expiration: 30-45 days
Max Profit: Limited but defined
Risk: Premium paid
Protective Puts:
Strike: $3,300 (below major support)
Expiration: Monthly
Purpose: Portfolio insurance
Cost: 1-2% of position value
ETF and Futures Considerations
Physical Gold ETFs:
GLD: Largest, most liquid
IAU: Lower expense ratio
SGOL: Swiss storage option
Gold Futures:
GC Contracts: Direct price exposure
Micro Gold: Smaller position sizing
Margin Requirements: Monitor closely
---
Technical Rating & Probability Assessment
Overall Technical Rating: STRONG BUY
Confidence Level: 8.5/10
Timeframe Ratings:
Intraday (1H-4H): BUY (85% bullish)
Short-term (Daily): STRONG BUY (90% bullish)
Medium-term (Weekly): STRONG BUY (85% bullish)
Long-term (Monthly): BUY (75% bullish)
Key Bullish Catalysts:
1. Technical Breakout: Clean break above $3,400 resistance
2. Fed Policy: Rate cut expectations building
3. Momentum: All timeframes aligned bullishly
4. Volume: Confirming accumulation patterns
Bearish Risk Factors:
1. Overextension: RSI levels stretched on weekly charts
2. Fed Hawkishness: Potential policy surprise
3. Dollar Strength: DXY recovery could pressure gold
4. Profit Taking: Natural at psychological $3,500 level
---
Weekly Trading Plan & Execution
Week of September 2-6, 2025
# Monday-Tuesday: Consolidation Expected
Strategy: Accumulate on dips to $3,420-$3,440
Targets: $3,480 resistance test
Risk Management: Tight stops below $3,400
# Wednesday-Thursday: Event Risk Management
Strategy: Reduce leverage ahead of economic data
Focus: Defensive positioning pre-NFP
Opportunity: Post-event volatility trades
# Friday: NFP Reaction Strategy
Bullish NFP: Sell the news, expect pullback
Bearish NFP: Add to long positions aggressively
Neutral NFP: Continue trend-following approach
Position Sizing Recommendations
Conservative: 2-3% portfolio allocation
Moderate: 5-7% portfolio allocation
Aggressive: 8-12% portfolio allocation
Risk per Trade: Maximum 1% of total capital
---
Long-Term Investment Thesis
Secular Bull Market Drivers
Monetary Debasement: Continued fiat currency depreciation
Geopolitical Uncertainty: Ongoing global tensions
Central Bank Demand: Record official sector purchases
Supply Constraints: Limited new mine development
Price Targets by Timeline
Q4 2025: $3,600-$3,800
Q1 2026: $3,800-$4,200
End 2026: $4,200-$4,800
2027-2028: $5,000+ potential
Investment Allocation Strategy
Core Holdings: 40% physical gold/ETFs
Trading Position: 30% futures/options
Mining Exposure: 20% quality miners
Cash Reserve: 10% for opportunities
---
Risk Disclaimers and Considerations
Market Risks
Volatility Risk: Gold can experience sharp moves
Liquidity Risk: Reduced liquidity during market stress
Currency Risk: USD movements affect returns
Storage Risk: Physical gold storage considerations
Regulatory and Tax Implications
Tax Treatment: Different rules for physical vs. paper gold
Reporting Requirements: Large position disclosure rules
Regulatory Changes: Potential trading restrictions
Technical Analysis Limitations
Pattern Failure: Technical patterns can fail
Black Swan Events: Unexpected market shocks
Model Risk: Over-reliance on historical patterns
Execution Risk: Slippage and timing issues
---
Conclusion & Strategic Recommendations
Gold's technical picture presents one of the most compelling bullish setups in recent history. Gold closed August with a strong daily close in premium territory, pressing into the 3460–3480 supply zone, with bulls maintaining control of momentum as September opens.
Immediate Action Items:
1. Accumulate Positions: Use any dip to $3,400-$3,420 as buying opportunity
2. Manage Risk: Implement proper position sizing and stop losses
3. Monitor Fed Policy: Watch for dovish signals supporting further upside
4. Prepare for Breakout: Position for potential move to $3,550-$3,600
Key Success Factors:
Discipline: Stick to predetermined risk management rules
Patience: Allow patterns to develop fully
Flexibility: Adapt to changing market conditions
Diversification: Use multiple gold investment vehicles
The confluence of technical, fundamental, and sentiment factors creates a rare alignment supporting significantly higher gold prices. While short-term volatility is expected, the medium to long-term outlook remains decidedly bullish.
Final Rating: STRONG BUY with careful risk management
I am nothing
Related publications
Disclaimer
The information and publications are not meant to be, and do not constitute, financial, investment, trading, or other types of advice or recommendations supplied or endorsed by TradingView. Read more in the Terms of Use.
I am nothing
Related publications
Disclaimer
The information and publications are not meant to be, and do not constitute, financial, investment, trading, or other types of advice or recommendations supplied or endorsed by TradingView. Read more in the Terms of Use.