✅ Structure:
Market Trend: Recently bearish — clear lower highs and lower lows from mid-June.
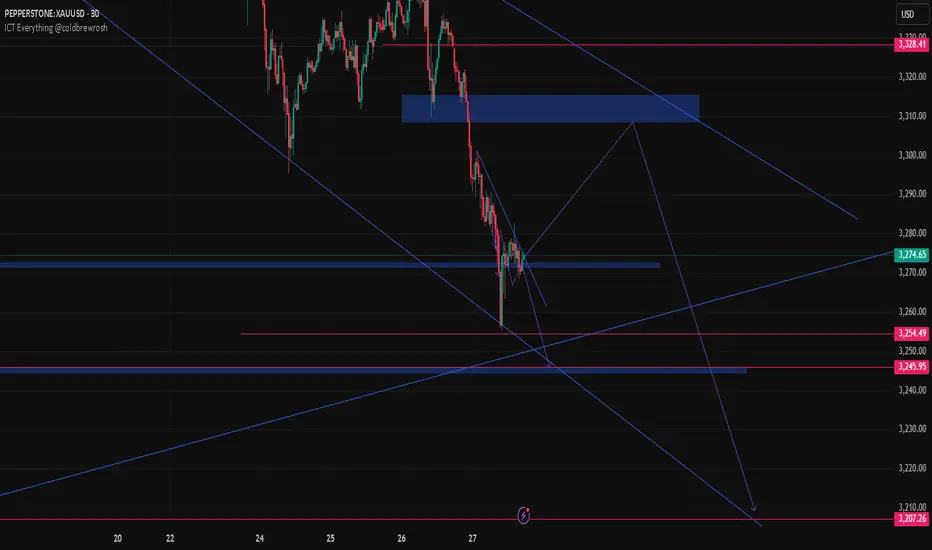
Current Price: ~$3274.65
Key Support Zone: $3255 – $3260 (tested and reacted)
Resistance Zone: $3300 – $3310 (minor), $3360 (major breakdown point)
✅ Price Action:
Gold dropped from ~$3400 to ~$3260 recently.
Price is attempting a small rebound but hasn’t broken structure.
Volume spike seen near $3260 – possible temporary demand area.
✅ ICT Concepts:
The recent sell-off could be a liquidity grab below previous lows (sell-side liquidity taken).
If price holds above $3260 and creates a bullish structure shift, there’s a chance of a reversal.
🌍 Fundamental Analysis (Geopolitical + Macro)
🔥 Geopolitical Tensions:
Middle East tensions are still active (Iran-Israel conflict potential).
Russia-Ukraine war continues to escalate, although slightly cooled down compared to earlier.
These factors generally support gold as a safe haven, especially during equity market volatility.
💰 Interest Rates (US):
As of June 2025:
Fed has paused rate hikes for two months.
Talks of potential rate cuts in Q3 if inflation continues to slow.
US CPI is cooling — latest YoY around 2.3%, close to the Fed’s 2% target.
Lower or stable rates favor gold, since lower yields reduce the opportunity cost of holding gold.
Disclaimer
The information and publications are not meant to be, and do not constitute, financial, investment, trading, or other types of advice or recommendations supplied or endorsed by TradingView. Read more in the Terms of Use.
Disclaimer
The information and publications are not meant to be, and do not constitute, financial, investment, trading, or other types of advice or recommendations supplied or endorsed by TradingView. Read more in the Terms of Use.