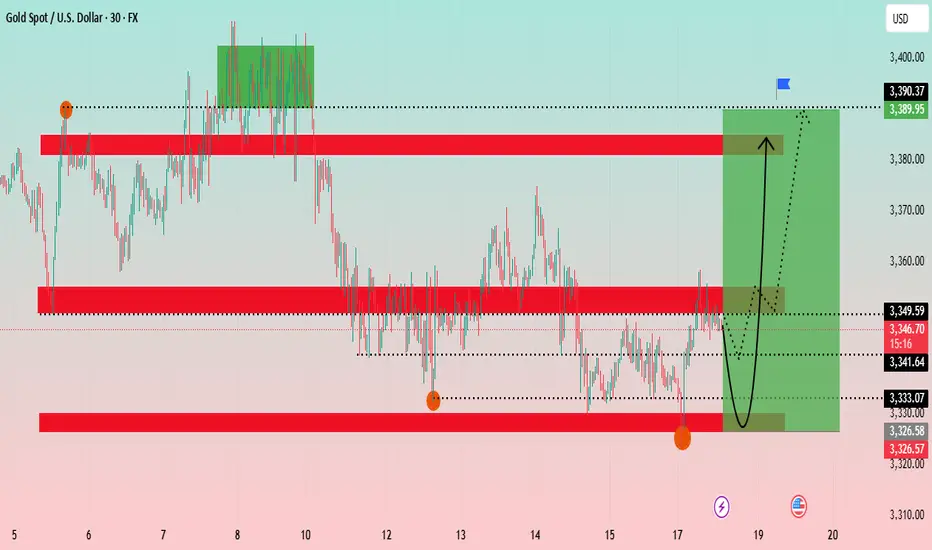
The Gold chart shows a 30-minute timeframe analysis, highlighting recent price consolidation and potential future trends. The analysis suggests a potential V-shape recovery for gold.
Key Levels: The price is currently at a critical juncture, having tested a support zone around 3,326 - 3,333 USD. This zone has proven to be a strong base. Above it, a significant resistance zone is identified between 3,349 - 3,353 USD. Further up, another major resistance is at approximately 3,389 USD.
Price Action: The price has recently experienced a sharp decline and is now in a consolidation phase. The chart projects a potential bounce from the current levels, indicated by the black curved arrow, with the target being the upper resistance zone around 3,389 USD. The green shaded box illustrates the potential upward movement from the current position.
Conclusion: Gold appears to be at a key support level and could be poised for a rally if it successfully breaks above the immediate resistance zone.
Bitcoin (BTC/USDT) 4-Hour Chart Analysis
The Bitcoin chart shows a 4-hour timeframe analysis, focusing on a short-term uptrend channel.
Key Levels: The price is trading within an ascending channel. A significant support zone is identified between 112,000 - 114,000 USDT. A "weak supply zone" is marked around 118,000 USDT, which is currently acting as support. A major resistance is at approximately 124,564 USDT.
Price Action: After a strong push towards the channel's upper boundary, the price has pulled back and is now retesting the "weak supply zone." The blue and red arrows project two possible scenarios: a bounce back up towards the channel's high, or a deeper retracement towards the channel's lower trendline. The price movement appears to be following the blue projected path.
Indicators: The Ichimoku cloud and RSI strategy are used to confirm the trend and identify entry/exit points. The price is above the Ichimoku cloud, indicating a bullish trend.
Conclusion: Bitcoin is at a pivotal point within its uptrend channel. Its ability to hold the 118,000 USDT level will be crucial for a potential re-test of the 124,564 USDT resistance.
Trade closed: target reached
join my telegram channel free
t.me/pipsandprofits0
t.me/pipsandprofits0
Daily 300+pips profits
weekly 2000+pips profit
High accuracy signals with double conformation
t.me/pipsandprofits0
t.me/pipsandprofits0
Daily 300+pips profits
weekly 2000+pips profit
High accuracy signals with double conformation
Related publications
Disclaimer
The information and publications are not meant to be, and do not constitute, financial, investment, trading, or other types of advice or recommendations supplied or endorsed by TradingView. Read more in the Terms of Use.