Chart Identification:
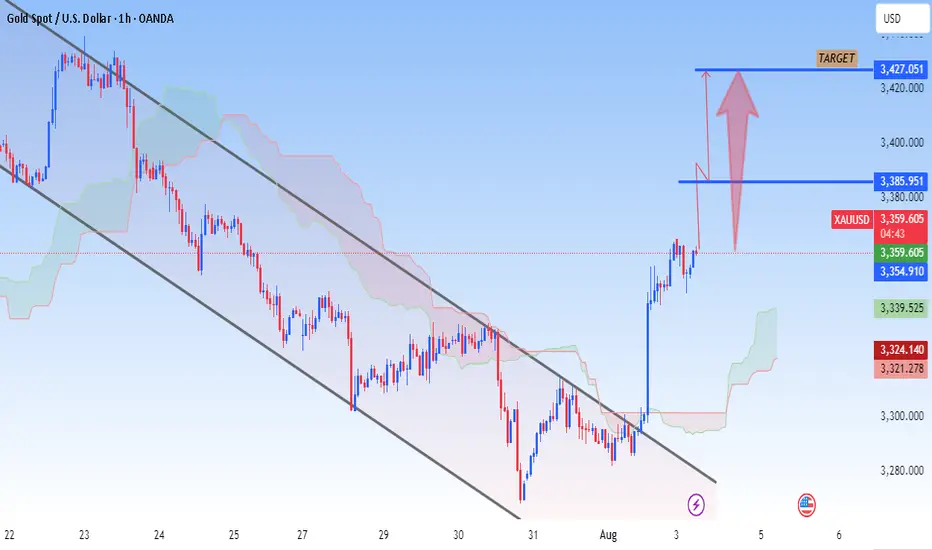
The chart shows a clear breakout from a descending channel.
A strong bullish momentum candle broke above the upper trendline.
Ichimoku Cloud shows bullish structure (price above the cloud).
A buy signal was triggered around $3,320–$3,325 after the breakout.
---
🎯 Target Levels (Buy Setup):
From the chart:
1. First Resistance / Take Profit 1:
$3,385 – $3,386 (marked horizontal zone)
2. Final Target (TP2):
$3,427 (highlighted as “TARGET” on the chart)
---
✅ Summary:
Entry Zone: Already triggered near $3,325–$3,330
TP1: $3,385
TP2: $3,427
Stop Loss (recommended): Below the Ichimoku cloud or near $3,300–$3,305 zone
Trade active
✅JOIN FREE TELEGRAM
✅t.me/+atTT3a4htZ8yZjQ0
✅DAILY 3-4 SIGNALS
✅ALL PAIRS CRYPTO & GOLD
✅t.me/+atTT3a4htZ8yZjQ0
✅DAILY 3-4 SIGNALS
✅ALL PAIRS CRYPTO & GOLD
Disclaimer
The information and publications are not meant to be, and do not constitute, financial, investment, trading, or other types of advice or recommendations supplied or endorsed by TradingView. Read more in the Terms of Use.