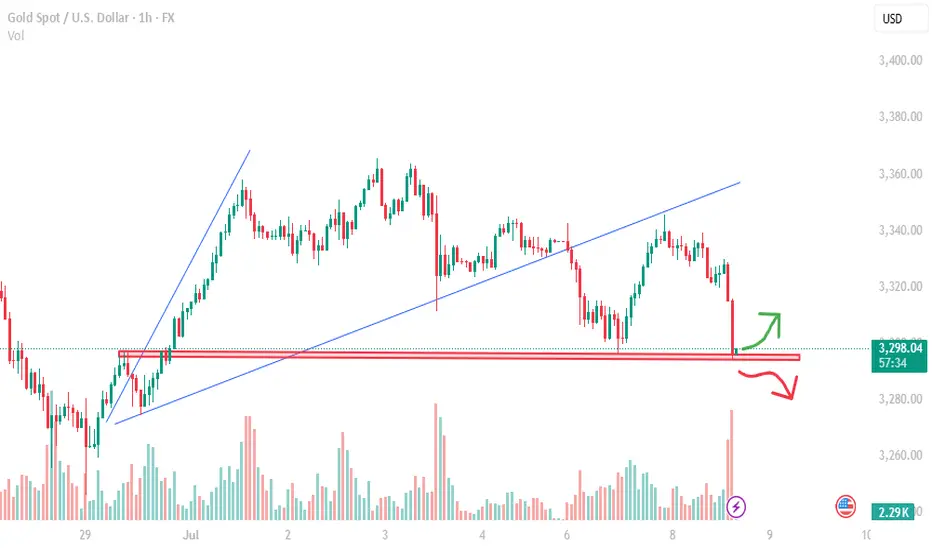
Gold (XAU/USD) is currently trading around $3,296, testing a major support zone after breaking down from a rising wedge pattern. The market is at a pivotal point, and the next move could define the short-term trend for Gold.
🔍 Technical Overview (1H Chart)
• The chart reveals a classic rising wedge pattern, a bearish reversal setup, which has now broken to the downside.
• Price is now hovering at the critical horizontal support zone near $3,295, which has acted as a key level several times in the past.
• A significant volume spike has accompanied the latest move down, highlighting strong selling pressure.
🟢 Bullish Case
If Gold holds above the $3,295 support zone, we could see a bounce and bullish continuation, targeting:
• Target 1: $3,315 (recent high)
• Target 2: $3,330 (next resistance zone)
Confirmation for this setup would require:
• A bullish reversal candle
• Increase in buying volume
• Break above minor intraday resistance levels
🔴 Bearish Case
If price breaks and closes below $3,294 with strong volume:
• Expect a sharp move lower toward $3,280 and potentially $3,260.
• The breakdown would validate the rising wedge pattern and confirm bearish momentum.
📊 Volume Insight
The recent red candle is accompanied by high volume, signaling strong participation by sellers. This increases the risk of a downside continuation unless immediate buying steps in.
🧠 Trading Plan Suggestion
📈 Long Setup
• Entry: Above $3,300 (after bullish confirmation)
• Stop-Loss: Below $3,294
• Take-Profit: $3,315 / $3,330
📉 Short Setup
• Entry: Below $3,294 (after breakdown candle)
• Stop-Loss: Above $3,300
• Take-Profit: $3,280 / $3,260
🔗 Final Thoughts
Gold is at a decision point. A bounce could attract bulls for a short-term rally, while a breakdown might trigger accelerated selling. Let the price confirm the move before entering, and manage risk wisely.
📅 Watch the next 1–2 candles closely — they will reveal the next direction.
Join Sarah Trades -
Free Telegram Signals : t.me/SarahAnalyticsSignals
For Gold signals: t.me/SarahAnalyticsSignals
Free Telegram Signals : t.me/SarahAnalyticsSignals
For Gold signals: t.me/SarahAnalyticsSignals
Related publications
Disclaimer
The information and publications are not meant to be, and do not constitute, financial, investment, trading, or other types of advice or recommendations supplied or endorsed by TradingView. Read more in the Terms of Use.