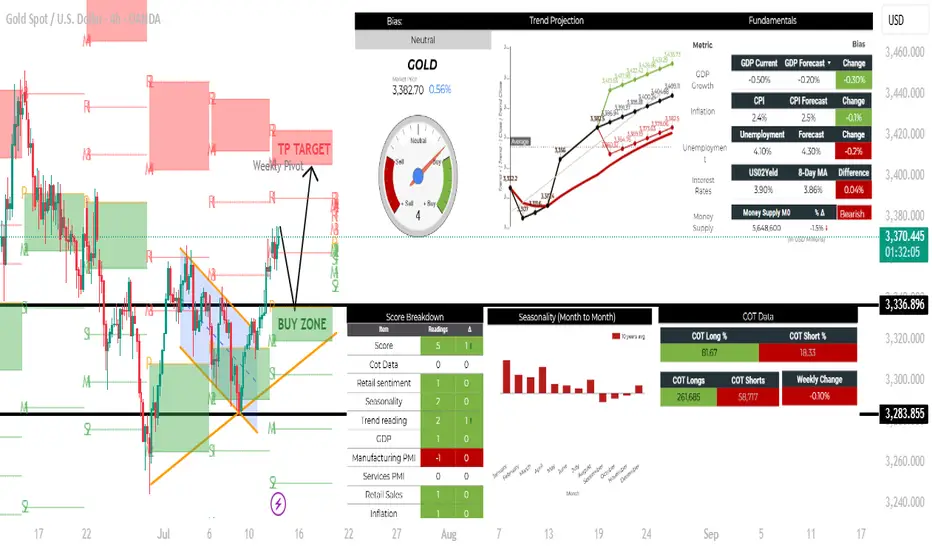
The 4-hour chart of XAU/USD (Gold Spot vs U.S. Dollar) presented reflects a technically structured bullish continuation setup, supported by both price action and key technical zones.
Technical Overview
1. Current Price Action:
Gold is trading near 3,371.335, slightly above a marked Weekly Pivot.
The price has recently broken out of a descending channel (orange trendlines), indicating a shift in market sentiment from bearish to bullish.
2. Support & Buy Zone:
A clear Buy Zone is delineated between approximately 3,336.896 and the lower support levels.
This region aligns with previous structural resistance turned support, and the neckline of a potential breakout area, suggesting strong demand interest.
3. Projected Price Movement:
The black arrows indicate a possible retracement scenario toward the Buy Zone (around 3,336.896), before a subsequent bullish leg toward the TP Target zone just below 3,420.000.
This price action reflects a classic bullish retest of the breakout zone.
4. Resistance Levels:
The TP TARGET area is highlighted just above the R2 Pivot level, within the 3,400–3,420 range, which historically serves as a strong resistance cluster.
The price would need to sustain momentum and volume to break this region.
5. Indicators & Tools:
Pivot points (M, R, S levels) are plotted, with current price hovering above the R1 level, suggesting a bullish short-term bias.
The breakout from the falling wedge/pennant pattern is typically followed by a measured move upward, supporting the bullish continuation scenario.
Conclusion
The current structure on the 4H timeframe indicates a bullish continuation bias, with a healthy retracement likely toward the 3,336 support area, which serves as a key inflection point. A successful retest and rebound from this level may validate the upside projection toward the 3,420 resistance zone, contingent upon broader market sentiment and momentum confirmation.
Continued monitoring of price behavior near the Buy Zone will be crucial, as failure to hold could invalidate the bullish scenario and potentially expose price to lower support levels such as 3,283.855 or 3,258.749.
Disclaimer
The information and publications are not meant to be, and do not constitute, financial, investment, trading, or other types of advice or recommendations supplied or endorsed by TradingView. Read more in the Terms of Use.
Disclaimer
The information and publications are not meant to be, and do not constitute, financial, investment, trading, or other types of advice or recommendations supplied or endorsed by TradingView. Read more in the Terms of Use.