From a technical point of view, the daily chart for the XAU/USD pair offers a neutral-to-bullish stance. The bright metal develops above all its moving averages, with the 20 Simple Moving Average (SMA) lacking directional strength at around $3,348.20. The 100 SMA, in the meantime, is partially losing its bullish strength, holding at around $3,319. Technical indicators, in the meantime, head nowhere at around their midlines, reflecting the ongoing consolidation.
In the near term, according to the 4-hour chart, XAU/USD is bullish. Technical indicators regain their upward scopes well above their midlines, and after a modest corrective decline. At the same time, a mildly bullish 20 SMA accelerated north below the longer ones, and is about to cross above the 200 SMA, bot around $3,350.
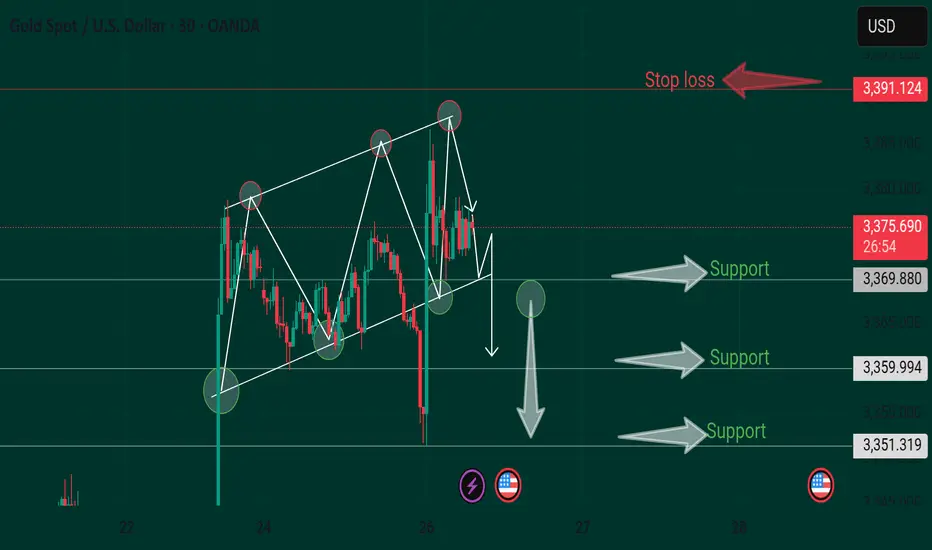
Xauusd signal 3376
Target 3350
Stop loss 3388
In the near term, according to the 4-hour chart, XAU/USD is bullish. Technical indicators regain their upward scopes well above their midlines, and after a modest corrective decline. At the same time, a mildly bullish 20 SMA accelerated north below the longer ones, and is about to cross above the 200 SMA, bot around $3,350.
Xauusd signal 3376
Target 3350
Stop loss 3388
Trade active
Xauusd signal sell 100 pips running Disclaimer
The information and publications are not meant to be, and do not constitute, financial, investment, trading, or other types of advice or recommendations supplied or endorsed by TradingView. Read more in the Terms of Use.
Disclaimer
The information and publications are not meant to be, and do not constitute, financial, investment, trading, or other types of advice or recommendations supplied or endorsed by TradingView. Read more in the Terms of Use.