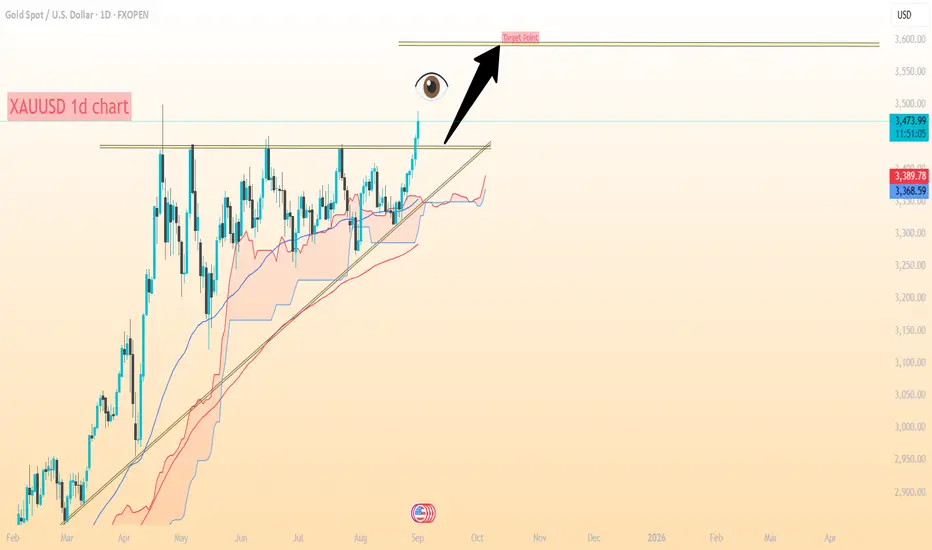
XAU/USD (Gold Spot vs USD) daily chart. Let’s analyze it carefully:
---
Current Market Context
Pair: Gold Spot / USD
Timeframe: 1D (Daily)
Current Price: ~3,474.9
Trend: Strong bullish breakout from a long consolidation range (above ~3,380–3,400 zone).
Indicators: Price is trading well above the Ichimoku cloud, showing strong upward momentum.
---
Targets
1. Immediate Target: Around 3,520 – 3,530
This is the next minor resistance after the breakout.
Possible short-term profit booking zone.
2. Major Target (as marked on your chart): 3,600 – 3,605
This aligns with my chart’s “Target Point.”
It is a psychological round number resistance level.
If bullish momentum continues, price could test this area in the coming sessions/weeks.
---
Trade Plan
Entry Zone: Around 3,470 – 3,480 (current levels).
Take Profit 1: 3,520 – 3,530.
Take Profit 2: 3,600 – 3,605.
Stop Loss (Protective): Below breakout zone (~3,380).
---
⚠ Note: Gold is very sensitive to US Dollar strength, Fed announcements, and economic data. If USD strengthens sharply, it could pull Gold back into the breakout zone.
---
Current Market Context
Pair: Gold Spot / USD
Timeframe: 1D (Daily)
Current Price: ~3,474.9
Trend: Strong bullish breakout from a long consolidation range (above ~3,380–3,400 zone).
Indicators: Price is trading well above the Ichimoku cloud, showing strong upward momentum.
---
Targets
1. Immediate Target: Around 3,520 – 3,530
This is the next minor resistance after the breakout.
Possible short-term profit booking zone.
2. Major Target (as marked on your chart): 3,600 – 3,605
This aligns with my chart’s “Target Point.”
It is a psychological round number resistance level.
If bullish momentum continues, price could test this area in the coming sessions/weeks.
---
Trade Plan
Entry Zone: Around 3,470 – 3,480 (current levels).
Take Profit 1: 3,520 – 3,530.
Take Profit 2: 3,600 – 3,605.
Stop Loss (Protective): Below breakout zone (~3,380).
---
⚠ Note: Gold is very sensitive to US Dollar strength, Fed announcements, and economic data. If USD strengthens sharply, it could pull Gold back into the breakout zone.
Trade active
trade activeNote
Xauusd 300 pips running start Note
xauusd 700 pips running profit📲 Join telegram channel free ..
t.me/RSI_Trading_Point4
Forex, Gold & Crypto Signals with detailed analysis & get consistent results..
t.me/RSI_Trading_Point4
Gold Signal's with proper TP & SL for high profit opportunities..
t.me/RSI_Trading_Point4
Forex, Gold & Crypto Signals with detailed analysis & get consistent results..
t.me/RSI_Trading_Point4
Gold Signal's with proper TP & SL for high profit opportunities..
Related publications
Disclaimer
The information and publications are not meant to be, and do not constitute, financial, investment, trading, or other types of advice or recommendations supplied or endorsed by TradingView. Read more in the Terms of Use.
📲 Join telegram channel free ..
t.me/RSI_Trading_Point4
Forex, Gold & Crypto Signals with detailed analysis & get consistent results..
t.me/RSI_Trading_Point4
Gold Signal's with proper TP & SL for high profit opportunities..
t.me/RSI_Trading_Point4
Forex, Gold & Crypto Signals with detailed analysis & get consistent results..
t.me/RSI_Trading_Point4
Gold Signal's with proper TP & SL for high profit opportunities..
Related publications
Disclaimer
The information and publications are not meant to be, and do not constitute, financial, investment, trading, or other types of advice or recommendations supplied or endorsed by TradingView. Read more in the Terms of Use.