Looking at price action on the 8th Mar 22, we witnessed the biggest bullish candle closure this year with previous ATH being just past $2075, price was very close to retesting it. The next following day, i would, as well as other gold traders want to expect a continuation of bullish momentum with a candle closure above ATH and even better, above the massive psychological handle, $2100 as my best bet would be that other traders to have their eyes on that level too.
However, a massive bearish engulfing candle of over 2.80% on the 9th of Mar 22 took place leading to XAU plummeting below the psychological level of $2000, spiking to the lows of $1960 before continuing the macro downside slump.
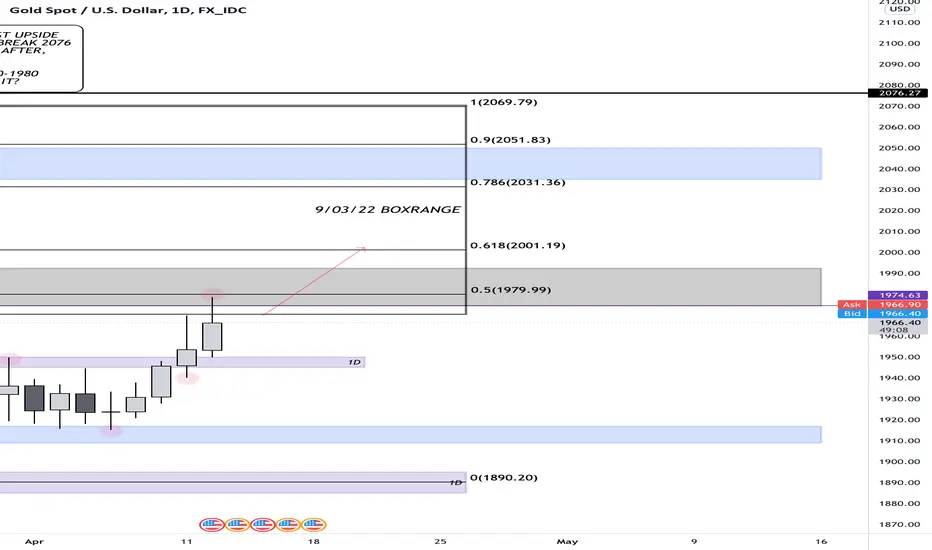
I have outlined a box region using the 9th Mar 22 for reference as to where bulls would most probably step in as there was massive amounts of people trading on that day, many longs were stopped out and those participants would want price to revisit at least 50% of bear candle before considering liquidating their position for a smaller loss hence why the fibonacci is there.
I am bullish to $2000; 61.8% zone all the way to the 78.6%;2030-2040* but open-minded about the opportunity that shorts could step in heavy as they did early March within the 'no-mans land area'
However, a massive bearish engulfing candle of over 2.80% on the 9th of Mar 22 took place leading to
I have outlined a box region using the 9th Mar 22 for reference as to where bulls would most probably step in as there was massive amounts of people trading on that day, many longs were stopped out and those participants would want price to revisit at least 50% of bear candle before considering liquidating their position for a smaller loss hence why the fibonacci is there.
I am bullish to $2000; 61.8% zone all the way to the 78.6%;2030-2040* but open-minded about the opportunity that shorts could step in heavy as they did early March within the 'no-mans land area'
UK, London
Disclaimer
The information and publications are not meant to be, and do not constitute, financial, investment, trading, or other types of advice or recommendations supplied or endorsed by TradingView. Read more in the Terms of Use.
UK, London
Disclaimer
The information and publications are not meant to be, and do not constitute, financial, investment, trading, or other types of advice or recommendations supplied or endorsed by TradingView. Read more in the Terms of Use.