XAU/USD (Gold) Technical Outlook – 1H Chart
💵 Current Price: ~3,310
🕒 Timeframe: 1 Hour (H1)
---
🔍 Key Technical Zones
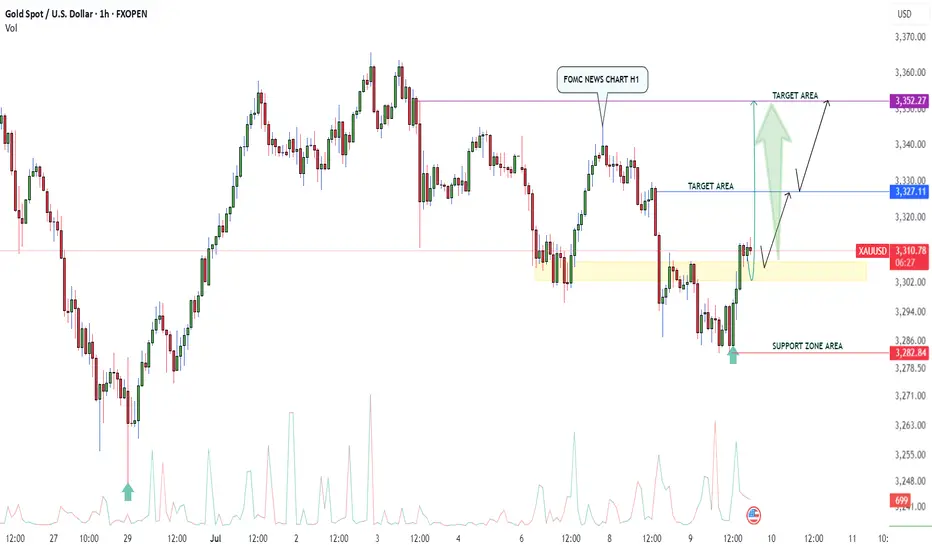
✅ Support Zone Area:
Level: 3,278 – 3,286
Price bounced strongly from this area, confirming it as a demand zone.
Marked with a green arrow showing bullish rejection and reversal.
Support Zone 3,278 – 3,286
Breakout Level 3,327
Target 1 3,327 – 3,330
Target 2 3,352 – 3,357
Invalidation Break below
Outlook is bullish while price holds above the support zone (3,286).
A break above 3,327 with confirmation would signal continuation to 3,352.
Monitor price action near 3,327 for breakout or rejection.
Would you like a full trade plan based on this (entry, SL, TP)?
📌 Stay alert for price Action and volume confirmation at key levels.
🚀 Momentum building - eyes on breakout!!
💵 Current Price: ~3,310
🕒 Timeframe: 1 Hour (H1)
---
🔍 Key Technical Zones
✅ Support Zone Area:
Level: 3,278 – 3,286
Price bounced strongly from this area, confirming it as a demand zone.
Marked with a green arrow showing bullish rejection and reversal.
Support Zone 3,278 – 3,286
Breakout Level 3,327
Target 1 3,327 – 3,330
Target 2 3,352 – 3,357
Invalidation Break below
Outlook is bullish while price holds above the support zone (3,286).
A break above 3,327 with confirmation would signal continuation to 3,352.
Monitor price action near 3,327 for breakout or rejection.
Would you like a full trade plan based on this (entry, SL, TP)?
📌 Stay alert for price Action and volume confirmation at key levels.
🚀 Momentum building - eyes on breakout!!
Trade active
First Target Done ($3327) Gold Hit ($3336) 260 + pips running if you did not close, you can risk-free your position Trade closed: target reached
Congratulations Those who Followed my Signals (XAU/USD) Target Done Trade From $3310 to $3352 .Almost we Achieved 420 pips .
Join me On Telegram
t.me/+ljZOrmYoIKg2NTY0
Gold Trading Signals 🚀 99%
t.me/+jn3XFiRWJII3ZDA0
Join My Recommended Broker, Link
👇
World Best Broker Exness ✅
one.exnesstrack.org/a/4xctfcub9x
t.me/+ljZOrmYoIKg2NTY0
Gold Trading Signals 🚀 99%
t.me/+jn3XFiRWJII3ZDA0
Join My Recommended Broker, Link
👇
World Best Broker Exness ✅
one.exnesstrack.org/a/4xctfcub9x
Disclaimer
The information and publications are not meant to be, and do not constitute, financial, investment, trading, or other types of advice or recommendations supplied or endorsed by TradingView. Read more in the Terms of Use.