XAUUSD (Gold vs USD) 1H chart. Let’s break it down:
📈 Current Setup
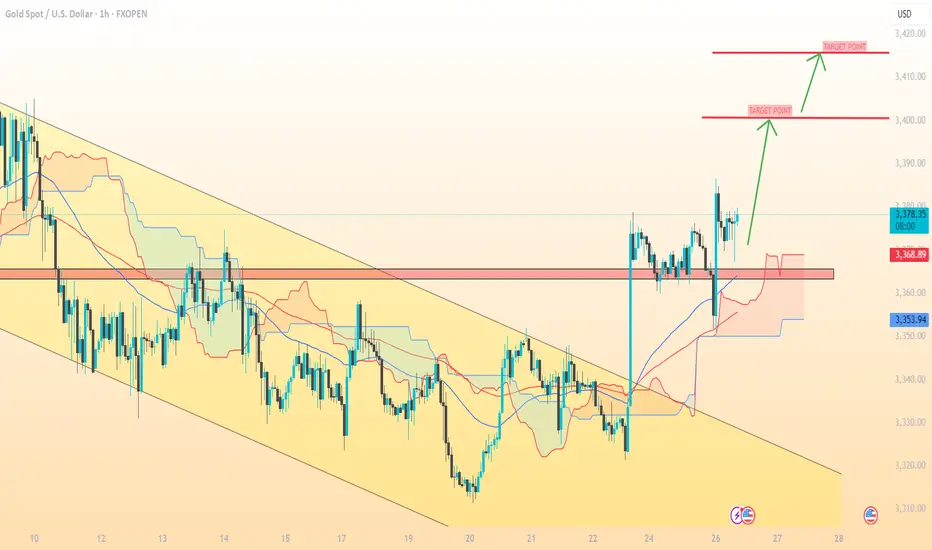
Price is around $3,378 – $3,379.
It has broken out of a descending channel (yellow zone).
Also pushed above Ichimoku cloud and resistance at $3,368, which is now acting as support.
My chart shows clear upside targets marked.
🎯 Target Levels (from your chart)
1. First Target Zone → Around $3,400
(psychological level and minor resistance).
2. Second Target Zone → Around $3,415
(major resistance, higher target point marked).
⚠ Notes
As long as gold holds above $3,368 (the breakout level), bullish momentum remains valid.
If price falls back below $3,355 – $3,360, the bullish breakout weakens, and it may re-enter the channel.
📈 Current Setup
Price is around $3,378 – $3,379.
It has broken out of a descending channel (yellow zone).
Also pushed above Ichimoku cloud and resistance at $3,368, which is now acting as support.
My chart shows clear upside targets marked.
🎯 Target Levels (from your chart)
1. First Target Zone → Around $3,400
(psychological level and minor resistance).
2. Second Target Zone → Around $3,415
(major resistance, higher target point marked).
⚠ Notes
As long as gold holds above $3,368 (the breakout level), bullish momentum remains valid.
If price falls back below $3,355 – $3,360, the bullish breakout weakens, and it may re-enter the channel.
Trade active
trade activeTrade closed: target reached
target done📲 Join telegram channel free ..
t.me/RSI_Trading_Point4
Forex, Gold & Crypto Signals with detailed analysis & get consistent results..
t.me/RSI_Trading_Point4
Gold Signal's with proper TP & SL for high profit opportunities..
t.me/RSI_Trading_Point4
Forex, Gold & Crypto Signals with detailed analysis & get consistent results..
t.me/RSI_Trading_Point4
Gold Signal's with proper TP & SL for high profit opportunities..
Related publications
Disclaimer
The information and publications are not meant to be, and do not constitute, financial, investment, trading, or other types of advice or recommendations supplied or endorsed by TradingView. Read more in the Terms of Use.
📲 Join telegram channel free ..
t.me/RSI_Trading_Point4
Forex, Gold & Crypto Signals with detailed analysis & get consistent results..
t.me/RSI_Trading_Point4
Gold Signal's with proper TP & SL for high profit opportunities..
t.me/RSI_Trading_Point4
Forex, Gold & Crypto Signals with detailed analysis & get consistent results..
t.me/RSI_Trading_Point4
Gold Signal's with proper TP & SL for high profit opportunities..
Related publications
Disclaimer
The information and publications are not meant to be, and do not constitute, financial, investment, trading, or other types of advice or recommendations supplied or endorsed by TradingView. Read more in the Terms of Use.