### Technical Analysis of Gold 4 Hour(XAU/USD)
#### Overview
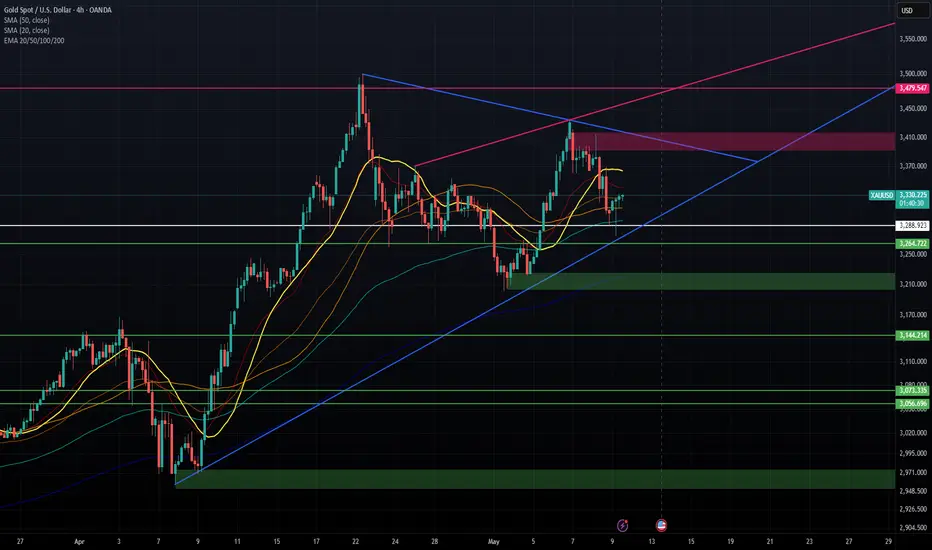
The chart displays the 4-hour price action for Gold (XAU/USD) with various technical indicators, including Simple Moving Averages (SMA) and Exponential Moving Averages (EMA), along with support and resistance levels. The displayed time frame suggests that this analysis focuses on short to medium-term trading strategies.
#### Current Price Action
- **Current Price**: The price of Gold is currently at approximately **3,325.13**. The price has recently bounced off a significant support level and is in a critical zone, indicating potential price action volatility.
#### Trend Analysis
- **Long-Term Trend**: The blue diagonal line illustrates an upward trend that started in early April. Gold’s price has consistently been above this trendline, indicating bullish sentiment in the market.
- **Short-Term Trend**: In the last week, the price peaked around **3432** but has since retraced towards the trendline. The price action suggests a consolidation phase currently on the chart.
#### Indicators
- **Moving Averages**:
- **SMA(50)**: It is bullish at **3,312.79**as the price remains above this moving average.
- **SMA(20)**: The shorter SMA at **3,363.54** indicates potential short-term resistance.
- **EMA (20)**: The EMA is slightly below the price at **3,295.59**, offering support if the price approaches this level.
The proximity of the price to the moving averages indicates an area of dynamic support and resistance, where traders may look for guidance on entry and exit points.
#### Support and Resistance Levels
- **Resistance Levels**:
- Clear resistance is observed at **3355/3370**
- The upward red trendline 3400/3416/3480 could also serve as dynamic resistance in the future.
- **Support Levels**:
- Strong support is found at **3,288.92**, coinciding with the recent consolidation's lower edges. The blue trendline provides additional support near **3,290**.
- Key support levels below are **3,264** and more significantly around **3,220 and 3,144**.
#### Price Patterns
- The chart displays a potential pennant formation, which generally precedes continuing the existing trend. Traders should be alert for breakout signals, either above resistance or below support, suggesting potential price movement toward the breakout.
#### Trade Considerations
- **Bullish Scenario**: A bullish breakout above the resistance level of **3365** with increasing volume could cement a further move towards the highs around **3410** or **3480**.
- **Bearish Scenario**: Conversely, a decisive break below the **blue trendline** or **support at 3,280** may trigger further downside with targets around **3,230/3200/3140** or lower.
#### Conclusion
The current price suggests that Gold is testing critical support levels while remaining in a longer-term uptrend. Traders should look for confirmation of direction through breakout patterns, volume, and market context. Monitoring economic data affecting Gold prices and general market sentiment will also be essential for making informed trading decisions.
We may not know what will happen, but we can prepare ourselves to respond effectively to whatever unfolds.
Stay grounded, stay present.🏄🏼♂️
Your comments and support are appreciated! 👊🏼 XAUUSD
#### Overview
The chart displays the 4-hour price action for Gold (XAU/USD) with various technical indicators, including Simple Moving Averages (SMA) and Exponential Moving Averages (EMA), along with support and resistance levels. The displayed time frame suggests that this analysis focuses on short to medium-term trading strategies.
#### Current Price Action
- **Current Price**: The price of Gold is currently at approximately **3,325.13**. The price has recently bounced off a significant support level and is in a critical zone, indicating potential price action volatility.
#### Trend Analysis
- **Long-Term Trend**: The blue diagonal line illustrates an upward trend that started in early April. Gold’s price has consistently been above this trendline, indicating bullish sentiment in the market.
- **Short-Term Trend**: In the last week, the price peaked around **3432** but has since retraced towards the trendline. The price action suggests a consolidation phase currently on the chart.
#### Indicators
- **Moving Averages**:
- **SMA(50)**: It is bullish at **3,312.79**as the price remains above this moving average.
- **SMA(20)**: The shorter SMA at **3,363.54** indicates potential short-term resistance.
- **EMA (20)**: The EMA is slightly below the price at **3,295.59**, offering support if the price approaches this level.
The proximity of the price to the moving averages indicates an area of dynamic support and resistance, where traders may look for guidance on entry and exit points.
#### Support and Resistance Levels
- **Resistance Levels**:
- Clear resistance is observed at **3355/3370**
- The upward red trendline 3400/3416/3480 could also serve as dynamic resistance in the future.
- **Support Levels**:
- Strong support is found at **3,288.92**, coinciding with the recent consolidation's lower edges. The blue trendline provides additional support near **3,290**.
- Key support levels below are **3,264** and more significantly around **3,220 and 3,144**.
#### Price Patterns
- The chart displays a potential pennant formation, which generally precedes continuing the existing trend. Traders should be alert for breakout signals, either above resistance or below support, suggesting potential price movement toward the breakout.
#### Trade Considerations
- **Bullish Scenario**: A bullish breakout above the resistance level of **3365** with increasing volume could cement a further move towards the highs around **3410** or **3480**.
- **Bearish Scenario**: Conversely, a decisive break below the **blue trendline** or **support at 3,280** may trigger further downside with targets around **3,230/3200/3140** or lower.
#### Conclusion
The current price suggests that Gold is testing critical support levels while remaining in a longer-term uptrend. Traders should look for confirmation of direction through breakout patterns, volume, and market context. Monitoring economic data affecting Gold prices and general market sentiment will also be essential for making informed trading decisions.
We may not know what will happen, but we can prepare ourselves to respond effectively to whatever unfolds.
Stay grounded, stay present.🏄🏼♂️
Your comments and support are appreciated! 👊🏼
Trade closed: target reached
👇 Website
srfxglobal.com/
👇 Telegram
t.me/SRFXGlobal
👇 YouTube
youtube.com/@srfxglobalsl?si=hbM2z2PURtIHCQvz
👇 X
x.com/SRFL1111
👇 Facebook
web.facebook.com/Friendship0002
srfxglobal.com/
👇 Telegram
t.me/SRFXGlobal
👇 YouTube
youtube.com/@srfxglobalsl?si=hbM2z2PURtIHCQvz
👇 X
x.com/SRFL1111
web.facebook.com/Friendship0002
Disclaimer
The information and publications are not meant to be, and do not constitute, financial, investment, trading, or other types of advice or recommendations supplied or endorsed by TradingView. Read more in the Terms of Use.