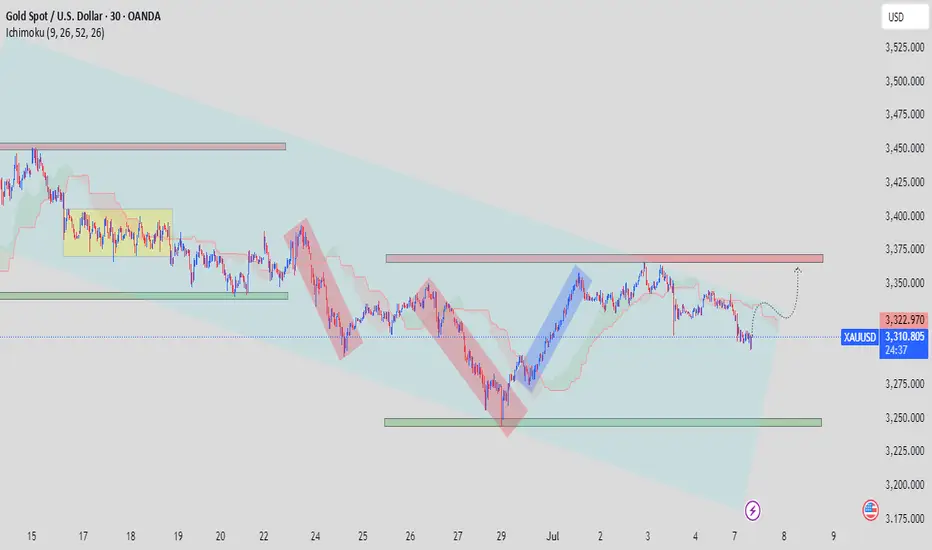
🟡 XAU/USD (Gold) 30-Min Chart Analysis — July 7, 2025
Potential Reversal Setup Toward Resistance Zone
---
✅ Technical Overview
Instrument: Gold Spot vs USD (XAU/USD)
Timeframe: 30-Minute
Indicators Used:
Ichimoku Cloud (9, 26, 52, 26)
Price Channels and Zones
Market Structure Patterns
---
📊 Key Observations
1. Descending Channel Structure
Price action has been following a well-defined descending channel (highlighted in green/blue).
Each move respects the channel's boundaries with multiple lower highs and lower lows.
2. Accumulation and Range Consolidation
Between June 17–19, we observe a range-bound consolidation (yellow box), suggesting accumulation before the breakout.
Current price action shows sideways movement near the lower boundary, potentially indicating another base formation.
3. Bullish Reversal Setup in Progress
A potential double bottom (formed around June 29 and July 5) aligns with the lower support zone (~3,245 USD).
The chart visually suggests a bullish corrective wave (dotted arrow) towards the upper supply zone (~3,360–3,380 USD).
4. Ichimoku Insights
Price is approaching the Ichimoku cloud, with possible TK cross support on lower timeframes.
A successful break and hold above the cloud would strengthen the bullish case.
---
📌 Key Zones to Watch
Zone Level (USD) Significance
Resistance 3,360 – 3,380 Key supply area from previous swing highs
Support 3,240 – 3,250 Demand zone; held twice recently
Mid-Level 3,325 (Ichimoku Kijun) Short-term resistance/trigger area
Trade active
✅JOIN FREE TELEGRAM
✅t.me/+atTT3a4htZ8yZjQ0
✅DAILY 3-4 SIGNALS
✅ALL PAIRS CRYPTO & GOLD
✅t.me/+atTT3a4htZ8yZjQ0
✅DAILY 3-4 SIGNALS
✅ALL PAIRS CRYPTO & GOLD
Related publications
Disclaimer
The information and publications are not meant to be, and do not constitute, financial, investment, trading, or other types of advice or recommendations supplied or endorsed by TradingView. Read more in the Terms of Use.