1. Momentum
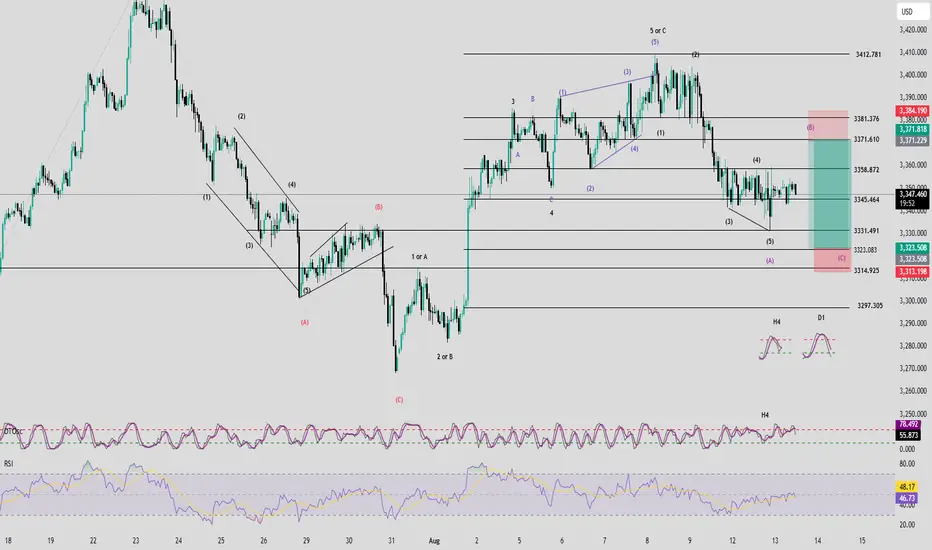
• D1 Timeframe: Momentum is about to enter the oversold zone. By the end of today, it is likely to be fully in oversold territory. This stage often leads to strong price movement – either a sharp decline or a bullish reversal.
• H4 Timeframe: Momentum is preparing to turn upward. We need to wait for the current H4 candle to close for confirmation. If confirmed, a recovery move is likely to occur today.
• H1 Timeframe: Momentum is currently tightening and approaching the overbought zone – a typical sign of sideways price action. This explains why, despite the high probability of a recovery, H1 does not yet provide a good entry signal.
________________________________________
2. Wave Structure
• RSI shows a bullish divergence between price and the indicator – a pattern often seen in wave 3 or wave 5. This supports the view that wave 5 (black) has completed around the 3333 level.
• With a complete 5-wave structure, wave A (red) of the ABC (red) correction may already be in place.
• A recovery in wave B (red) is expected, which aligns with H4 momentum preparing to turn upward. Wave B typically forms a 3-wave corrective structure, where price moves in a choppy, overlapping manner rather than trending strongly.
• Wave B target zones:
1. 3371
2. 3381
These two levels are close to each other, so they can be treated as one combined zone. The plan is to take the first target as the base level while extending the SL to cover the second target. If price approaches these levels, it’s best to watch real-time price action before entering a trade.
• Alternative scenario: If wave 5 (black) is not yet complete, the 3323 zone remains a good Buy opportunity (as per the previous analysis).
________________________________________
3. Trading Plan
Sell Setup:
• Entry Zone: 3371 – 3373
• SL: 3385
• TP1: 3358
• TP2: 3331
• TP3: 3323
Buy Setup:
• Entry Zone: 3323 – 3321
• SL: 3313
• TP1: 3331
• TP2: 3357
• TP3: 3371
2. Wave Structure
• RSI shows a bullish divergence, often seen in wave 3 or 5, suggesting wave 5 (black) may have completed around 3333.
• Wave A (red) of the ABC cycle may be complete; wave B (red) is expected to recover in a 3-wave, choppy pattern.
• Wave B target zone: 3371–3381 (treated as one zone; monitor price action before entry).
• Alternative scenario: If wave 5 (black) is not yet complete, 3323 remains a potential Buy zone.
Trade active
+ 60 pips Trade closed: target reached
+140 pips👉 Join the channel to receive more scalping signals!
Channel Telegram: t.me/+XkFQ95yHVOEwNDc1
Channel Telegram: t.me/+XkFQ95yHVOEwNDc1
Related publications
Disclaimer
The information and publications are not meant to be, and do not constitute, financial, investment, trading, or other types of advice or recommendations supplied or endorsed by TradingView. Read more in the Terms of Use.
👉 Join the channel to receive more scalping signals!
Channel Telegram: t.me/+XkFQ95yHVOEwNDc1
Channel Telegram: t.me/+XkFQ95yHVOEwNDc1
Related publications
Disclaimer
The information and publications are not meant to be, and do not constitute, financial, investment, trading, or other types of advice or recommendations supplied or endorsed by TradingView. Read more in the Terms of Use.