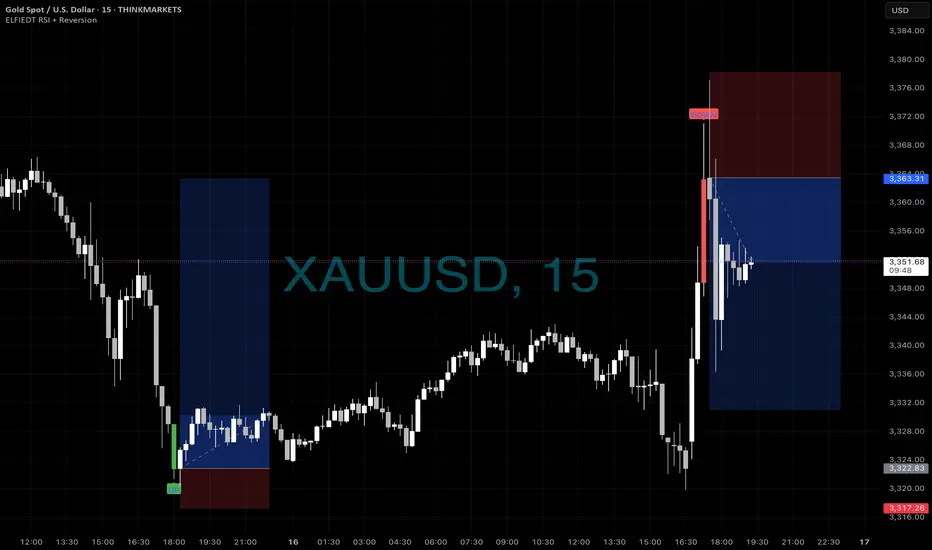
🟩 TRADE RECAP: GOLD (XAUUSD) — ELFIEDT RSI + REVERSION
Timeframe: 15-minute
Indicator Used: ELFIEDT RSI + Reversion
Date: July 15–16
Market: Gold (XAUUSD)
⸻
🟢 TRADE 1 – LONG SETUP (“UP” Signal)
📍 Location: Left side of chart (July 15, ~18:00)
🟢 Label: “UP”
🟦 Blue Entry Box: Bullish Reversion Zone
🟥 Red SL Box: Risk-defined stop zone below the signal bar
✅ Why This Trade Was Taken:
• 📉 Price sharply sold off into extreme oversold conditions.
• 📊 RSI with Standard Deviation Reversion: The RSI value pierced below the 3-standard-deviation envelope, triggering a BUY signal.
• 🟢 “UP” label was automatically printed by the ELFIEDT indicator.
• 🧠 System confirms that price is statistically stretched below mean, ideal for mean-reversion trades.
• 📈 Entry was executed immediately at the close of the signal bar.
• 🛡️ Stop loss was placed below the signal bar’s low, as per system rules.
🎯 Outcome:
• Price reversed strongly back toward the mean.
• Trade moved cleanly in favor, validating the signal and model.
⸻
🔴 TRADE 2 – SHORT SETUP (“DOWN” Signal)
📍 Location: Right side of chart (July 16, ~18:00)
🔴 Label: “DOWN”
🟦 Blue Entry Box: Bearish Reversion Zone
🟥 Red SL Box: Risk-defined stop zone above signal bar
✅ Why This Trade Was Taken:
• 📈 Sharp bullish spike pushed price far above equilibrium.
• 📊 RSI exceeded the upper 3-standard-deviation threshold, triggering a SELL signal.
• 🔴 “DOWN” label appeared based on confluence of overbought + RSI reversal structure.
• 📉 The bearish candle close confirmed exhaustion at the top.
• 📍 Entry was taken at the close of the “DOWN” signal bar.
• 🛡️ Stop was placed above the high of the trigger bar, per indicator rules.
🎯 Outcome:
• Price quickly rejected the highs and dropped into profit territory.
• Tight structure with clean entry allowed favorable risk:reward.
⸻
🔍 About the Indicator: ELFIEDT RSI + Reversion
This system is built on the principle that price tends to revert to its mean when it becomes statistically stretched — confirmed by:
• ✅ RSI divergence
• ✅ Break of trendlines
• ✅ Reversion from extreme zones using a 3 SD envelope
• ✅ Directional confirmations from candle structure and session timing
📊 Signals include:
• 📍 “UP” and “DOWN” trade labels
• 📦 Entry and SL box overlays
• 🎨 Candle color overlays based on 50MA and RSI alignment
• 🔔 Alerts at signal bar close (non-repainting
📸 Visual Recap:
🔹 The chart shows:
• ✅ Clear visual entries with SL and TP zones
• ✅ “UP” and “DOWN” labels for intuitive guidance
• ✅ No repainting – signals locked at close
Join us to get free access to all indicators we created!
Disclaimer
The information and publications are not meant to be, and do not constitute, financial, investment, trading, or other types of advice or recommendations supplied or endorsed by TradingView. Read more in the Terms of Use.
Join us to get free access to all indicators we created!
Disclaimer
The information and publications are not meant to be, and do not constitute, financial, investment, trading, or other types of advice or recommendations supplied or endorsed by TradingView. Read more in the Terms of Use.