Technical Overview
1. Previous Trend (Before Box Zone):
A sharp downtrend can be seen on the left.
Followed by a rising channel (bearish flag) — this is typically a continuation pattern suggesting further downside.
Price broke down from this rising channel, confirming the bearish continuation.
2. Current Price Action (Boxed Area):
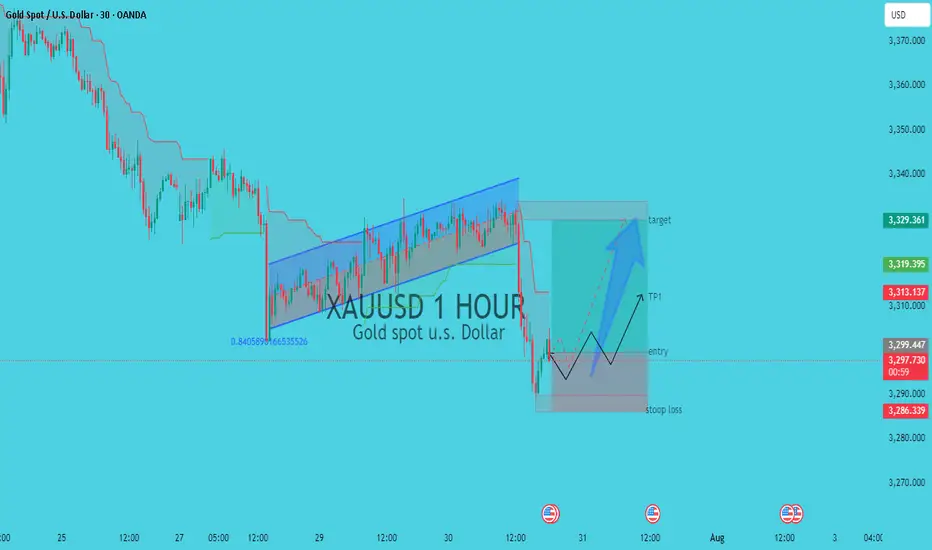
Price dropped significantly, then entered a consolidation/accumulation box (sideways movement).
The chart shows a double bottom or accumulation structure with potential for reversal upward.
A blue projected path indicates a possible bullish breakout from the accumulation zone.
✅ Entry Point
Around $3,299.447 — current or slightly above current price.
This is based on a potential reversal from the support line in the box.
🎯 Targets:
TP1: Near $3,310
Final Target: Around $3,329.361 (where previous support turned resistance from the broken channel).
❌ Stop Loss:
Just below the box, at $3,286.339, to protect against a bearish breakdown continuation.
---
🧠 Key Technical Concepts Involved:
Bearish Flag Breakdown: Price broke below the flag, confirming weakness.
Support Zone: Current price is consolidating in a demand zone.
Bullish Reversal Pattern: Signs of a double bottom or accumulation phase.
Risk Management: Clear stop loss and take-profit levels shown.
---
🔍 What to Watch:
Confirmation of Breakout: Wait for a strong bullish candle above the top of the box or above $3,300 for added confirmation.
Volume Spike: Ideally, breakout should be supported by rising volume.
Macro Events: This chart also shows economic calendar icons at the bottom — likely US news/events. Be cautious as these can impact gold significantly.
---
📌 Conclusion:
This is a bullish counter-trend setup after a sell-off. It anticipates a short-term recovery or relief rally toward previous support-turned-resistance. However, overall trend remains bearish, so caution is advised — especially near the $3,330 resistance.
1. Previous Trend (Before Box Zone):
A sharp downtrend can be seen on the left.
Followed by a rising channel (bearish flag) — this is typically a continuation pattern suggesting further downside.
Price broke down from this rising channel, confirming the bearish continuation.
2. Current Price Action (Boxed Area):
Price dropped significantly, then entered a consolidation/accumulation box (sideways movement).
The chart shows a double bottom or accumulation structure with potential for reversal upward.
A blue projected path indicates a possible bullish breakout from the accumulation zone.
✅ Entry Point
Around $3,299.447 — current or slightly above current price.
This is based on a potential reversal from the support line in the box.
🎯 Targets:
TP1: Near $3,310
Final Target: Around $3,329.361 (where previous support turned resistance from the broken channel).
❌ Stop Loss:
Just below the box, at $3,286.339, to protect against a bearish breakdown continuation.
---
🧠 Key Technical Concepts Involved:
Bearish Flag Breakdown: Price broke below the flag, confirming weakness.
Support Zone: Current price is consolidating in a demand zone.
Bullish Reversal Pattern: Signs of a double bottom or accumulation phase.
Risk Management: Clear stop loss and take-profit levels shown.
---
🔍 What to Watch:
Confirmation of Breakout: Wait for a strong bullish candle above the top of the box or above $3,300 for added confirmation.
Volume Spike: Ideally, breakout should be supported by rising volume.
Macro Events: This chart also shows economic calendar icons at the bottom — likely US news/events. Be cautious as these can impact gold significantly.
---
📌 Conclusion:
This is a bullish counter-trend setup after a sell-off. It anticipates a short-term recovery or relief rally toward previous support-turned-resistance. However, overall trend remains bearish, so caution is advised — especially near the $3,330 resistance.
Trade closed: stop reached
sorry guys stop loss hitBest Analysis xauusd single
t.me/+uAIef7IqwSs4M2Q0
VIP PREMIMUM ANALYSIS ROOM SIGNALS
t.me/+uAIef7IqwSs4M2Q0
t.me/+uAIef7IqwSs4M2Q0
VIP PREMIMUM ANALYSIS ROOM SIGNALS
t.me/+uAIef7IqwSs4M2Q0
Disclaimer
The information and publications are not meant to be, and do not constitute, financial, investment, trading, or other types of advice or recommendations supplied or endorsed by TradingView. Read more in the Terms of Use.
Best Analysis xauusd single
t.me/+uAIef7IqwSs4M2Q0
VIP PREMIMUM ANALYSIS ROOM SIGNALS
t.me/+uAIef7IqwSs4M2Q0
t.me/+uAIef7IqwSs4M2Q0
VIP PREMIMUM ANALYSIS ROOM SIGNALS
t.me/+uAIef7IqwSs4M2Q0
Disclaimer
The information and publications are not meant to be, and do not constitute, financial, investment, trading, or other types of advice or recommendations supplied or endorsed by TradingView. Read more in the Terms of Use.