Momentum
• D1 timeframe: Momentum is still rising → High probability that price will continue its bullish move on Monday.
• H4 timeframe: Momentum remains bullish → Price is expected to keep rising early in the week to complete wave (3) in yellow.
• H1 timeframe: Momentum is heading into the oversold zone → The short-term correction is nearing its end, we look for buy opportunities.
Wave Structure
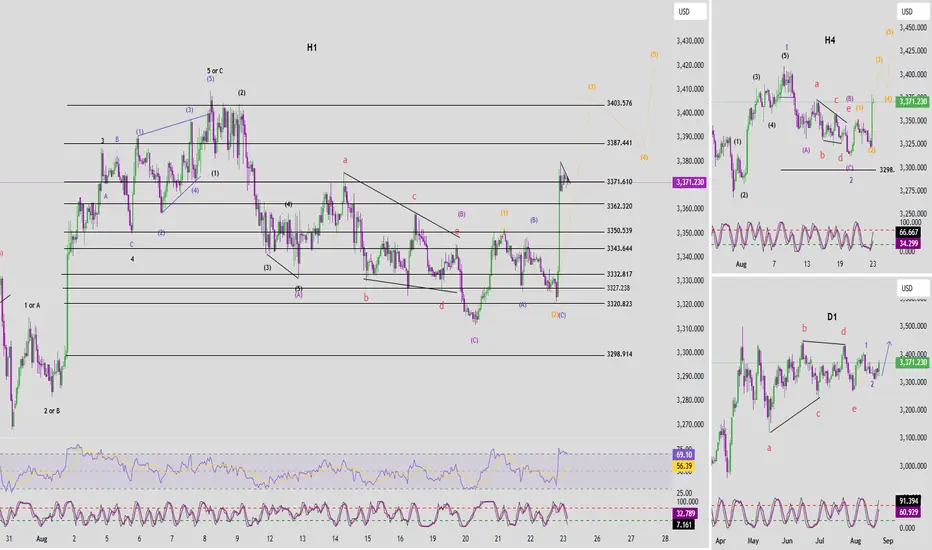
• D1 timeframe: Friday’s strong bullish candle reinforces the scenario that wave (1) and (2) in blue are complete, and wave (3) in blue may already be forming. We need price to break above the top of wave (1) in blue to confirm the development of wave (3).
• H4 timeframe: Price rallied sharply and broke above the top of wave (1) in yellow → This confirms price is currently in wave (3) in yellow. With momentum on H4 still rising, wave (3) likely has more room to continue.
• H1 timeframe: The corrective ABC structure has completed, followed by a sharp and steep rally (as projected in Friday’s plan). Price broke above 3350 – the top of wave (1) in yellow → Confirming the scenario that price is in wave (3) in yellow.
o Minimum target for wave (3) in yellow: 3387.
o Principle: Do not counter-trade wave (3); instead, wait for wave (4) correction to look for buy entries in wave (5).
Trading Strategy
With H1 approaching the oversold zone and showing a mild correction, we have two options for entries:
1. Breakout: Wait for price to break above the small descending trendline as shown on the chart → Enter breakout buy.
2. Pullback entry: Wait for price to retrace to the 3362 area → Buy from there.
Trade Plan:
• Buy Zone: 3364 – 3361
• Stop Loss: 3354
• Take Profit:
o TP1: 3378
o TP2: 3387
o TP3: 3403
• D1 timeframe: Momentum is still rising → High probability that price will continue its bullish move on Monday.
• H4 timeframe: Momentum remains bullish → Price is expected to keep rising early in the week to complete wave (3) in yellow.
• H1 timeframe: Momentum is heading into the oversold zone → The short-term correction is nearing its end, we look for buy opportunities.
Wave Structure
• D1 timeframe: Friday’s strong bullish candle reinforces the scenario that wave (1) and (2) in blue are complete, and wave (3) in blue may already be forming. We need price to break above the top of wave (1) in blue to confirm the development of wave (3).
• H4 timeframe: Price rallied sharply and broke above the top of wave (1) in yellow → This confirms price is currently in wave (3) in yellow. With momentum on H4 still rising, wave (3) likely has more room to continue.
• H1 timeframe: The corrective ABC structure has completed, followed by a sharp and steep rally (as projected in Friday’s plan). Price broke above 3350 – the top of wave (1) in yellow → Confirming the scenario that price is in wave (3) in yellow.
o Minimum target for wave (3) in yellow: 3387.
o Principle: Do not counter-trade wave (3); instead, wait for wave (4) correction to look for buy entries in wave (5).
Trading Strategy
With H1 approaching the oversold zone and showing a mild correction, we have two options for entries:
1. Breakout: Wait for price to break above the small descending trendline as shown on the chart → Enter breakout buy.
2. Pullback entry: Wait for price to retrace to the 3362 area → Buy from there.
Trade Plan:
• Buy Zone: 3364 – 3361
• Stop Loss: 3354
• Take Profit:
o TP1: 3378
o TP2: 3387
o TP3: 3403
Trade active
Trading Plan Update – XAUUSDMomentum Analysis
• H4 timeframe: Momentum has turned bearish → In the short term, there is a possibility that price will continue to decline until the evening, meaning the market is still in a corrective phase.
• Timing: This correction is lasting longer compared to the previous development of waves 1, 2, and 3. This suggests that wave 1 of wave 3 has likely completed, and the market is currently moving within wave 2 of wave 3.
Wave Structure
• H1 timeframe: Wave 2 in black is unfolding in an ABC corrective structure.
o First target for wave C: 3350
o Second target for wave C: 3340
Trading Plan
• For Buy entries at 3361 – 3364, move Stop Loss to 3359, as the main scenario is not yet invalidated.
• Alternative scenario: If price continues to follow the current corrective path
o Buy Zone: 3351 – 3349
o Stop Loss: 3336
o Take Profit:
TP1: 3362
TP2: 3387
TP3: 3403
👉 Join the channel to receive more scalping signals!
Channel Telegram: t.me/+XkFQ95yHVOEwNDc1
Channel Telegram: t.me/+XkFQ95yHVOEwNDc1
Related publications
Disclaimer
The information and publications are not meant to be, and do not constitute, financial, investment, trading, or other types of advice or recommendations supplied or endorsed by TradingView. Read more in the Terms of Use.