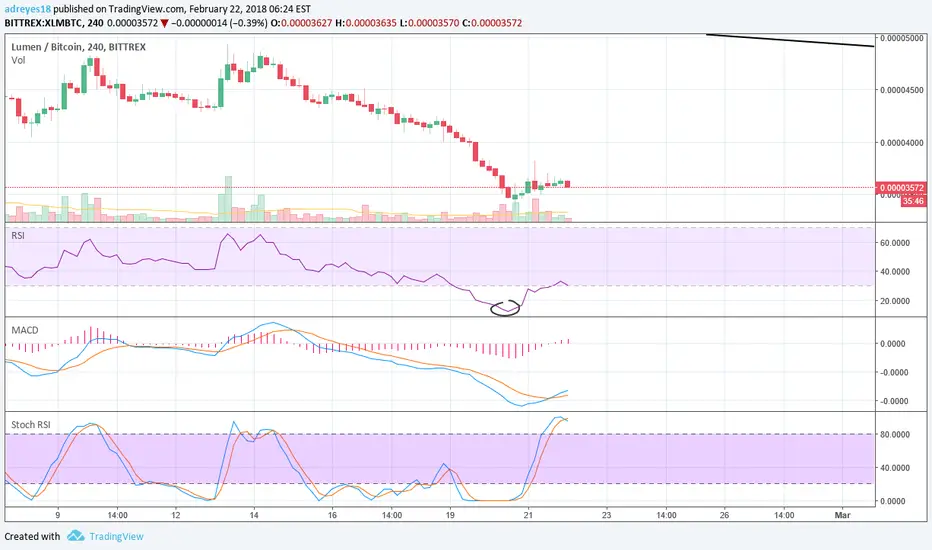
From the looks of the 4 hour chart, we can see the mac d crossover, but still too far below the signal line. The RSI dropped low relative to its previous history, but no major sign of liftoff. The stoch is making a fascinating pattern, but the price hasn't acted upon it.
Looking at the 1 hour chart along with the 4 hour, we're likely to see a decent breakout at some point by the end of the week after a small drop.
On the 1 hour you can see the most recent flag, which could indicate a reversal if the mac d signals. If prices break past that doji with the black line over it, we could see a run.
The 1 day chart is still looking bearish, however. Although it seems like XLM is correcting after a negative break out of the bollinger bands, the MACD is bumping past the signal line. It looks like we're headed down for the support line, at exactly .618 retracement.
According to the 1 day chart, the massive breakout it coming within the next couple of months. However, based on what BTC is doing, XLM is prone to react. If we see solid correction from the majors and volume pick back up soon, no doubt XLM soars to the moon. We're still looking bear as of now, but I believe we'll see a reversal in here very soon.
Disclaimer
The information and publications are not meant to be, and do not constitute, financial, investment, trading, or other types of advice or recommendations supplied or endorsed by TradingView. Read more in the Terms of Use.
Disclaimer
The information and publications are not meant to be, and do not constitute, financial, investment, trading, or other types of advice or recommendations supplied or endorsed by TradingView. Read more in the Terms of Use.