1. Current Setup
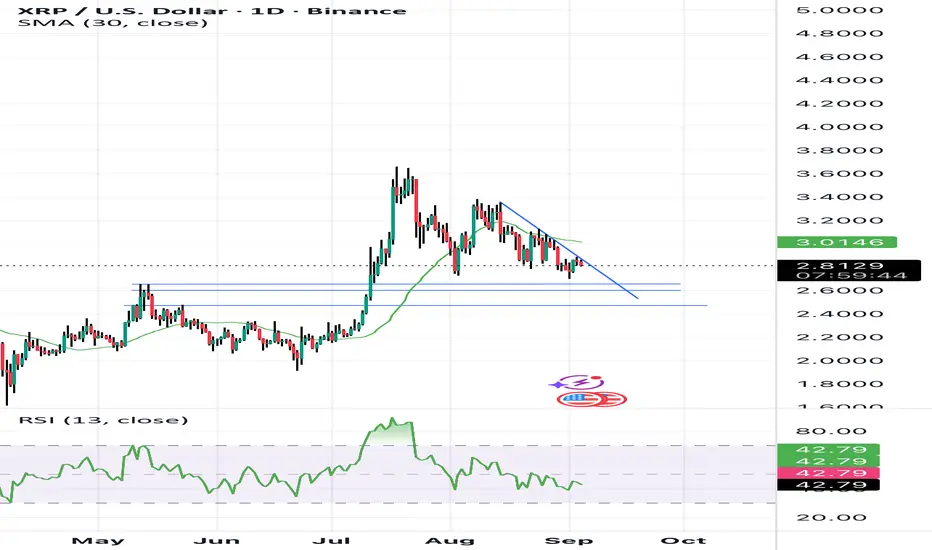
• Price is at $2.81, trending downward from the $3.60 peak.
• A descending triangle pattern is forming → bearish continuation signal.
• Price is under the 30 SMA, showing sellers in control.
• RSI ~42 → neutral-to-bearish, no oversold condition yet, so there’s room to fall further.
⸻
2. Key Levels
• Immediate support: $2.70 – price has tested this area multiple times.
• Next support zone: $2.50 – aligned with previous consolidation zone.
• Major support: $2.30 – strong historical demand area.
If those break, the next significant level is around $2.00.
⸻
3. Bearish Triggers
• A close below $2.70 could trigger selling momentum → target $2.50.
• Failure to hold $2.50 would likely accelerate towards $2.30.
• If $2.30 fails, the descending structure points to a capitulation move towards $2.00.
⸻
4. Indicators Supporting Bearish Case
• Lower highs → sellers consistently stepping in earlier.
• Bearish RSI divergence (momentum declining while price tried to recover).
• SMA flattening and rolling down, acting as dynamic resistance.
⸻
5. Bearish Targets
• Short-term: $2.70 (3 days)
• Medium-term: $2.50 (10 days)
Disclaimer
The information and publications are not meant to be, and do not constitute, financial, investment, trading, or other types of advice or recommendations supplied or endorsed by TradingView. Read more in the Terms of Use.
Disclaimer
The information and publications are not meant to be, and do not constitute, financial, investment, trading, or other types of advice or recommendations supplied or endorsed by TradingView. Read more in the Terms of Use.