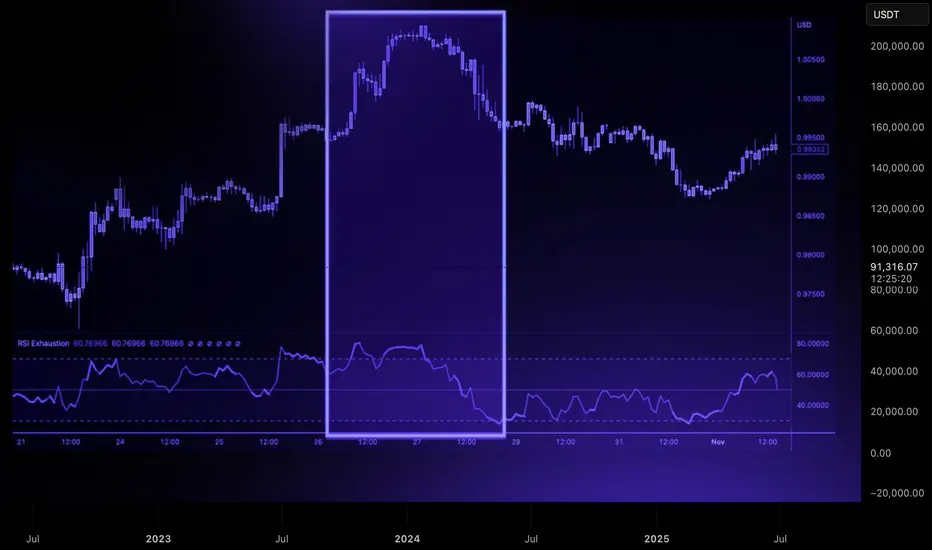
BITCOIN ! HAPPY THANKSGIVING ! Does the 1D MA200 spoil the mood?First of all allow me to wish everyone Happy Thanksgiving with all the blessings this day may bring to your family and loved ones.
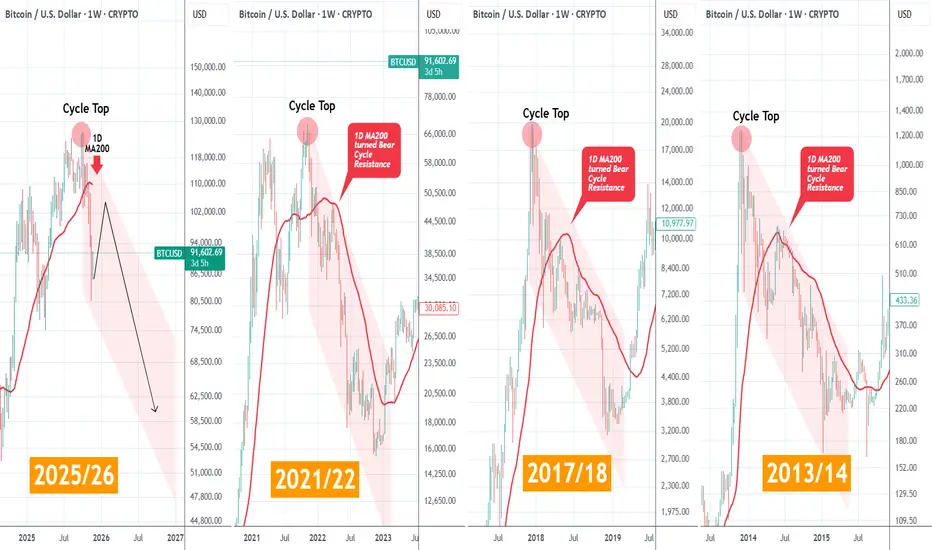
As for Bitcoin (BTCUSD), the anticipated short-term rebound is targeting the first Lower High of the emerging Bear Cycle. What's critical in this? The 1D MA200 (red trend-line) and the reason is simple.
As the previous three Cycles show on this graph, when BTC starts a Bear Cycle and breaks below its 1D MA200, it then turns into the Resistance for the rest of the Cycle. And as you can see, it rejected every single time the Lower Highs. Practically that is the most optimal level for someone to short for as long as the Bear Cycle lasts.
As a result, we expect the current counter-trend rally/ dead-cat bounce (call it as you want), to be limited by the 1D MA200, which is currently at $110k and falling, then get rejected and start the next Bearish Leg of the Channel Down.
So do you think the 1D MA200 will play the role of the long-term Resistance from now on? Feel free to let us know in the comments section below!
---
** Please LIKE 👍, FOLLOW ✅, SHARE 🙌 and COMMENT ✍ if you enjoy this idea! Also share your ideas and charts in the comments section below! This is best way to keep it relevant, support us, keep the content here free and allow the idea to reach as many people as possible. **
---
💸💸💸💸💸💸
👇 👇 👇 👇 👇 👇
Community ideas
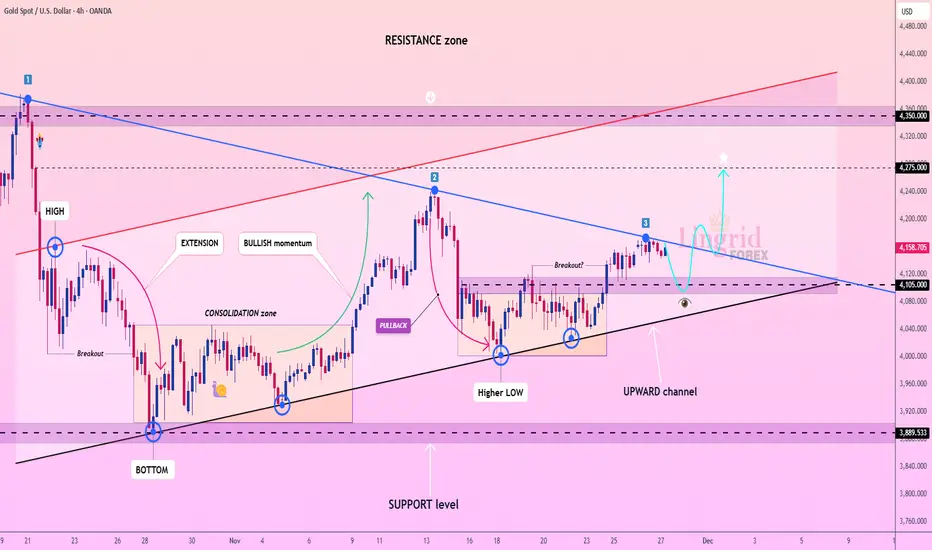
Lingrid | GOLD Trendline Break - Price AccelerationOANDA:XAUUSD is testing the downward trendline for the third touch, a historically significant point where price often attempts a breakout. The market structure has been steadily building higher lows from the 3,900 support level, while buyers continue to defend the bottom of the upward channel. Current consolidation just above 4,100 suggests accumulation rather than exhaustion, especially after price already produced a clean rebound from the channel floor.
If TVC:GOLD breaks and holds above major trendline, momentum may accelerate quickly toward 4,275, the mid-resistance barrier inside the broader supply zone. A successful continuation above this mark opens the way for a deeper squeeze, where major liquidity sits. With USD volatility cooling and safe-haven demand stabilizing, the bullish scenario remains favorable as long as price maintains bullish structure.
➡️ Primary scenario: breakout above trendline → continuation toward 4,275.
⚠️ Risk scenario: failure at trendline → drop back toward 4,000 support.
If this idea resonates with you or you have your own opinion, traders, hit the comments. I’m excited to read your thoughts!

Bitcoin - 66k in 2026 (but first a pump - watch this!)Bitcoin has been going down drastically, as I expected many, many weeks in advance. But this is not the end of the crash! We will see lower prices in 2026, specifically 66k and possibly 50k later in Q3 2026. This is my long-term vision, but in the short term I think Bitcoin should go up to retest the previous long-term trendline and the previous falling wedge pattern at 97k! Usually after a breakout/breakdown, we want to see a retest. These retests are very important because they give us a chance to sell Bitcoin at a better price and also to short Bitcoin on the futures market.
Bitcoin did some pretty crazy movements in the past weeks, regardless of the seasonality patterns. Statistically Bitcoin is extremely strong in October and November—but this time it was the opposite. Even though seasonality patterns are helpful, you always need to look for more indicators and fundamentals. Moonboys that were screaming for 200k and 500k got liquidated, and soon they will disappear from the market for good. I have been trading for almost 10 years, and I have experienced many crypto crashes, and the moonboys are always here at the top. When I was bearish at 120k, everyone was screaming in the comment section and even spitting on my bearish predictions.
So my plan for the next Bitcoin movements is as follows: First, Bitcoin should retest the 97k level (this will take some time). After that we should see another big leg to the downside to 66k.
Write a comment with your altcoin + hit the like button, and I will make an analysis for you in response. Trading is not hard if you have a good coach! This is not a trade setup, as there is no stop-loss or profit target. I share my trades privately. Thank you, and I wish you successful trades!

GOLD → Consolidation above the support level of the new rangeFX:XAUUSD is consolidating above 4150 but within the distribution phase after breaking through consolidation. The upward price movement is supported by the weakening of the dollar...
The metal remains on track for a fourth month of growth thanks to expectations of further Fed rate cuts and geopolitical tensions.
Despite strong US data, markets are still pricing in a 76-85% probability of a rate cut in December. The dollar is weakening, although yields are rising slightly.
Against the backdrop of the holiday week in the US, volatility may decrease and gold may consolidate. Talks about a possible peace between Russia and Ukraine could reduce demand for safe-haven assets, but the overall backdrop remains favorable for XAU/USD growth.
Resistance levels: 4170, 4211
Support levels: 4146, 4139
Gold is consolidating above the key support zone of 4140-4146. A long squeeze could trigger a shift in market imbalance in favor of buyers. If the bulls keep the price above 4150, this could trigger further growth, a breakout of 4170, and a retest of 4211.
Best regards, R. Linda!

Bitcoin - Can the bulls break resistance?Bitcoin continues to stagnate after a strong sell-off. Market structure remains weak, and trading volume is declining as price keeps moving sideways within a tight range. Traders are uncertain about the next move, and both bulls and bears currently lack conviction. Overall sentiment is cool, with most attention focused on nearby resistance zones. Many eyes are on how BTC reacts to the current consolidation area.
4H Bearish FVG
Just above the current price lies a clear bearish 4-hour Fair Value Gap (FVG). This zone now acts as strong resistance. When BTC retests this area, a rejection is the most likely scenario. Only a breakout with strong volume would give bulls something to lean on. As long as this FVG holds, further downside remains the path of least resistance.
1H Timeframe
The 1-hour timeframe shows ongoing consolidation and repeated struggles with the local 1H bearish FVG. Every attempt to break through this area is immediately rejected. As a result, the probability of BTC breaking to the downside increases, which would allow the market to collect the liquidity resting below. Bears are expected to keep defending this zone until the market breaks through with conviction. Consolidation may continue as long as the support level holds, but the underlying downside risk remains significant.
Conclusion
BTC remains technically pressured as long as there is no convincing breakout above the 4H FVG. The current range is vulnerable to a downward break, especially with weak volume and persistent resistance structures. Traders would be wise to wait for clearer signals or a new trend on higher timeframes before committing to a direction.

EURUSD Downside Outlook: Price Eyes Retest of 1.1540 Buyer ZoneHello traders! Here’s my technical outlook on EUR/USD based on the current market structure. After testing the Seller Zone near 1.16000–1.16200, the price once again faced rejection, forming a fake breakout around the descending Resistance Line. This confirms that sellers are still defending this area and keeping the pair inside a broader bearish structure. From there, EUR/USD pulled back toward the Buyer Zone, located between 1.15400–1.15000, which has acted as a reliable support area multiple times. The market is now moving inside a corrective pattern, showing weakening bullish momentum as it approaches support. As long as the pair trades below the Seller Zone and the descending trendline, bearish pressure remains dominant. The chart suggests a likely continuation toward the TP1 target at 1.15400, where buyers previously stepped in and produced notable recoveries. A clean bounce from this zone may trigger another short-term bullish correction — but without a breakout above 1.16000, any upside is likely to remain limited. A breakdown below 1.15400 could open the way for deeper declines toward lower support levels, while a confirmed breakout above the Seller Zone would shift short-term sentiment. Please share this idea with your friends and click Boost 🚀


Stocks Stage Comeback in Time for Thanksgiving. What's Behind ItIt’s Thanksgiving, and you know what that means. “Hey, sweety, why don't you come here and let us know how your high-beta stocks are doing. Here’s our little investor.”
And for once, the answer isn’t followed by a sigh. Stock traders are heading into the holiday with something they haven’t had in a while — gains and optimism.
Major US indices just logged their fourth straight day of gains, with the Nasdaq Composite on pace for its best Thanksgiving week since 2008.
That’s right: the last time the Nasdaq had a holiday rally this strong, we were still explaining what a “smartphone” was.
This year, it’s all about two things:
A dovish Federal Reserve
An AI trade that refuses to sit idle
Let’s carve into what’s driving this seasonal sprint.
📈 AI Fears Cool Off
The market has spent the past month wrestling with fears that AI stocks were puffing up like an overfilled Thanksgiving parade balloon. But this week, the anxiety faded.
Microsoft NASDAQ:MSFT , CoreWeave NASDAQ:CRWV , Dell NYSE:DELL , and even suddenly-revived AI-adjacent names have found solid footing again. The Nasdaq TVC:IXIC jumped 0.8% on Wednesday, outpacing the other indices and reminding investors that tech still runs this town.
What changed?
No new AI scandals and bubble talk
No shocking spending pivots (thanks, Meta NASDAQ:META )
No high-profile shorts announcing apocalyptic bets (thanks, Burry)
And some great data-center guidance in recent earnings ( thanks, Dell NYSE:DELL )
Even Nvidia NASDAQ:NVDA , which has been under the most scrutiny , clawed back 1.4% Wednesday — though the stock is still well off its early-month peak.
Investors are clearly reshuffling their AI winners, but the trade lives on. A shakeout doesn’t mean a shutdown.
🟩 Breadth Returns: Not Just a Tech Party
All but two sectors of the S&P 500 SP:SPX moved higher Wednesday, pushing the broader index up 0.7%.
The Dow TVC:DJI matched that performance, rising 315 points, with both indices tracking for their best Thanksgiving week since 2012.
Even the defensive sectors joined in. When utilities and consumer staples start partying with semiconductors and mega-cap tech, you know sentiment’s shifting.
🏦 The Fed Is Quietly Setting the Table
Just a week ago, the odds of a December rate cut were a coin toss — roughly 50/50 according to CME FedWatch. Today, that probability has surged to more than 80%.
What a cut could mean to traders:
Cheaper borrowing
Higher valuations
Softer financial conditions
And fewer landmines in the months ahead
Nothing gets markets into the holiday spirit like the smell of potential rate cuts.
This week is also shortened — stock markets are closed Thursday and shut early Friday (ref: the economic calendar ). With fewer trading hours to log, investors often front-load their optimism or their panic. This time, it’s mostly optimism.
🔄 Nvidia Isn’t Gone — It’s Just Taking a Breath
Nvidia’s stock remains sharply lower from its early November highs, but Wednesday’s move showed there’s still life in the AI leader.
Meta NASDAQ:META , Alphabet NASDAQ:GOOGL , and select cloud names have picked up flows as traders diversify their AI bets.
And while Nvidia might not be the main driver of the rally this week (spoiler alert: it’s Google ), its ability to stay positive helped prevent any emotional selling from spreading through tech.
🧁 The Warm, Lightly-Toasted Takeaway
If you were expecting a quiet, uneventful lead-in to the holidays — the market apparently had other plans.
Here’s where we’re at now:
A four-day winning streak,
A revival in Big Tech,
A broad rally across sectors,
And Fed expectations suddenly swinging toward cuts.
Off to you : Will it last through December? With inflation, rate decision, and jobs data, will AI stocks keep marching higher or retreat? Share your view in the comments and, to our US folks, enjoy Thanksgiving!

GBPUSCHello Traders! 👋
What are your thoughts on GBPSUD?
GBP/USD has broken out of its descending channel and is now pulling back to retest the broken structure.
Once the pullback to the broken level is completed, the pair is expected to resume its upward movement toward the marked target level.
As long as price holds above the broken channel, the bullish scenario remains valid.
Don’t forget to like and share your thoughts in the comments! ❤️

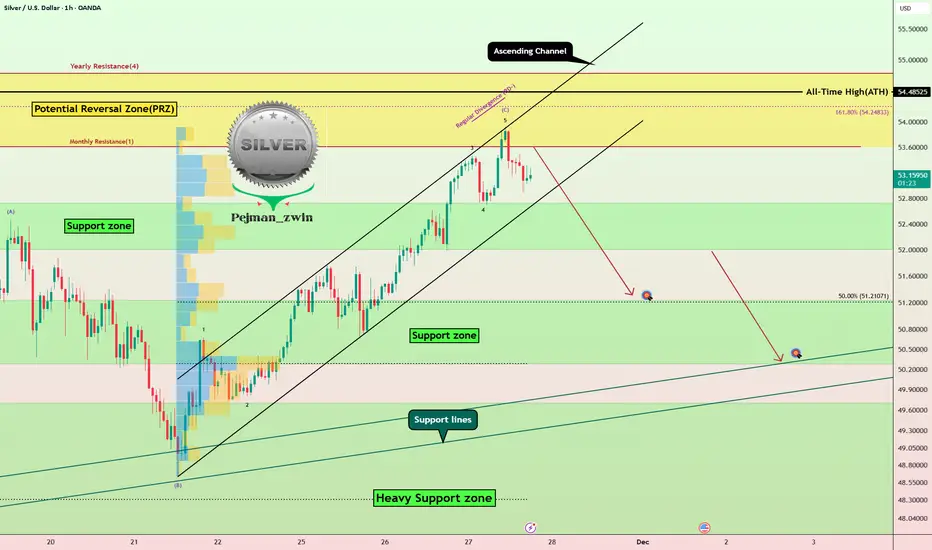
Silver Warning: RD- + PRZ = Short Opportunity?Today, we're diving into Silver ( OANDA:XAGUSD ), and it seems that there’s a potential short opportunity on the horizon.
Currently, silver is approaching a Potential Reversal Zone(PRZ) and an ascending channel.
From an Elliott Wave perspective, it appears that silver has completed wave C of an Expanding Flat Pattern(3-3-5/ABC).
Additionally, we’re noticing a Regular bearish Divergence (RD-) between the price peaks, which adds to the bearish sentiment.
I expect that, following a break below the lower line of the ascending channel, silver could also break through its Support zone($52.73-$52.00) and potentially decline to around the $51.33 level.
First Target: $51.33
Second Target: Support lines
Stop Loss(SL): $54.63
💡 Please respect each other's opinions and express agreement or disagreement politely.
📌 Silver/ U.S. Dollar Analyze (XAGUSD), 1-hour time frame.
🛑 Always set a Stop Loss(SL) for every position you open.
✅ This is just my idea; I’d love to see your thoughts too!
🔥 If you find it helpful, please BOOST this post and share it with your friends.
Bitcoin: Final Pump Before the Fall?Over the past five to six days, Bitcoin ( BINANCE:BTCUSDT ) has been attempting to recover from previous weekly declines, and it still appears to be in a corrective phase. This analysis builds on my previous idea, and if you’d like a deeper look at Bitcoin’s mid-term chart, you can check out the 4-hour timeframe in that previous analysis .
Now, a key point for Bitcoin traders is that, despite the recent rally in the S&P 500 ( SP:SPX ) over the past few days, Bitcoin hasn’t been able to keep pace. While it had a good correlation with the S&P 500 in the past, it didn’t experience a similar upward movement this time. Therefore, once the S&P 500 corrects, we may also see Bitcoin resume its downward trend.
Currently, Bitcoin seems to be near a resistance zone($92,200-$88,400) and Cumulative Short Liquidation Leverage($91,570-$89,660). It also appears to be forming an ascending channel over the past few days, indicating a corrective structure.
From an Elliott Wave perspective, Bitcoin seems to be completing microwave C of the microwave Y of the main wave 4, and we can expect this corrective phase to end soon, leading to another downward move. A break of the lower line of the ascending channel would confirm the end of this Wave 4.
I expect that after the Cumulative Short Liquidation Leverage($91,570-$89,660), Bitcoin will resume its decline and move towards the Support zone($86,200-$85,130).
Cumulative Long Liquidation Leverage: $86,000-$85,000
Cumulative Long Liquidation Leverage: $83,249-$81,840
Cumulative Long Liquidation Leverage: $80,263-$78,131
First Target: $86,290
Second Target: $83,800
Stop Loss(SL): $92,229
Points may shift as the market evolves
Note: At lower price levels, Bitcoin’s price includes several Cumulative Short Liquidation Leverages, each potentially causing further price drops. However, if the S&P 500 starts another correction, these levels may break more easily.
Note: Overall, trading in crypto has become a bit challenging lately, with less volatility, so it’s wise to be cautious and manage your capital carefully.
Note: If Bitcoin breaks through the resistance zone($92,200-$88,400) around $92,229, we can expect a renewed upward trend and hope for a bullish movement.
💡 Please respect each other's opinions and express agreement or disagreement politely.
📌Bitcoin Analysis (BTCUSDT), 1-hour time frame.
🛑 Always set a Stop Loss(SL) for every position you open.
✅ This is just my idea; I’d love to see your thoughts too!
🔥 If you find it helpful, please BOOST this post and share it with your friends.

Bitcoin recovers rise again moveBitcoin is showing signs of bullish consolidation after a prolonged decline into key support. Based on the current range structure, the market may be preparing for an upward move.
The recovery aligns with broader market sentiment, as U.S. stock indices recorded their fourth consecutive session of gains, driven by expectations of potential Federal Reserve interest-rate cuts.
From a technical perspective, if Bitcoin can hold bullish momentum and secure a 4H candle close above the 90,000 level, it would strengthen the case for continuation to the upside. After the recent long fall, price may look to retest overhead resistance in the 98,000 – 105,000 zone.
You may find more details in the chart.
Trade wisely best of Luck buddies.
Ps; support with like and comments for better analysis thanks for supporting.

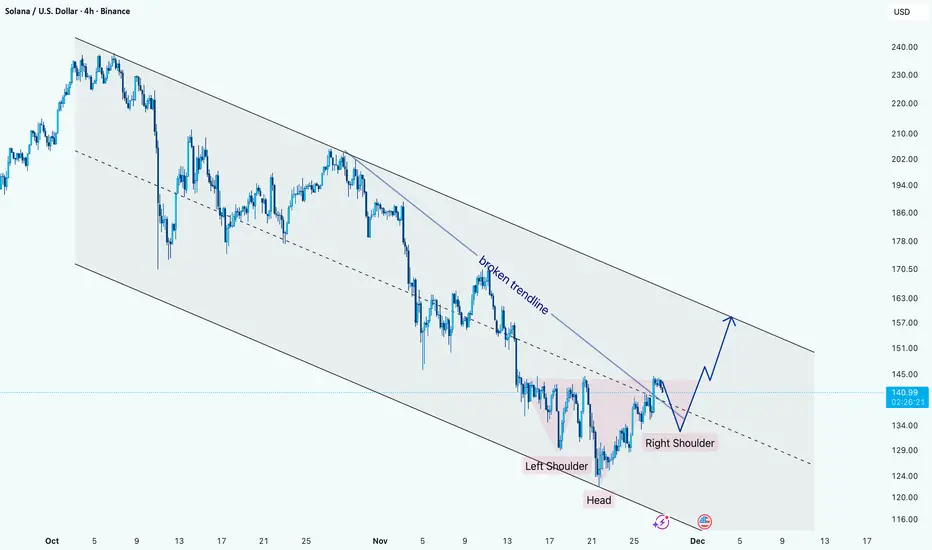
SOL Reversal Structure Forming Inside Downtrend ChannelHi!
Solana is trading inside a well-defined descending channel, but momentum is shifting. Price has broken the inner descending trendline and is now forming a clear inverse Head & Shoulders at the bottom of the structure.
The neckline zone has been tested multiple times, showing growing buyer strength. As long as price holds above the right-shoulder support, the structure favors a bullish continuation.
A breakout above the neckline opens the way toward the upper boundary of the main descending channel, with the next key reaction zone near $155–160. Failure to hold the right shoulder would delay the reversal and pull the price back toward mid-channel support.
Gold Ready for a Breakout – Watch This Zone!Gold is currently trading inside a well-defined symmetrical triangle, developing multiple BOS and CHoCH signals that indicate growing bullish momentum. After rejecting the lower trendline, price is now approaching a potential breakout zone.
A retest of the triangle’s upper boundary could trigger a clean bullish continuation toward the 4,248 level, which aligns with previous structural highs.
Keep an eye on the retest and confirmation candle before entering.
Bias: Bullish above structure / Neutral inside the triangle

USDJPY Pauses Around 156.272, Waiting for DirectionHello everyone,
USD/JPY is currently consolidating near 156.272. Buyers lack momentum to push higher, while sellers aren’t strong enough to drive it lower. This sideways movement reflects market hesitation before the next directional move.
FVG gaps appear on both sides, showing unbalanced flows. The gap just below 156.272 is notable and could be filled soon. Volume clusters around 156.400 act as a key upper barrier.
If selling pressure increases and 156.272 is broken, 156.000 becomes the next test, with 155.800 further down as a potential target if the downtrend continues.
US economic data, Fed rate expectations, and BoJ signals will likely guide the next move for this pair. How do you see USD/JPY developing from here?

Trend Exhaustion: How to Spot a Reversal Before It HappensReversals rarely start with dramatic candles. They begin quietly, through subtle shifts in momentum and structure that most traders overlook.
A strong trend doesn’t collapse all at once. It loses strength in stages, and those stages are visible long before price turns in the opposite direction.
The first sign of exhaustion is weakening impulse strength. In a healthy trend, impulsive moves are clean and decisive, and retracements are controlled. When each new push produces smaller higher highs or lower lows, it signals reduced participation.
Buyers or sellers are still present, but the force driving the trend is fading.
The second clue lies in how price interacts with liquidity. Strong trends break key levels with conviction. Exhausted trends start reaching above highs or below lows only to reject immediately.
These sweeps show that the market is clearing liquidity without gaining follow-through, often trapping late entries and signaling that larger players are offloading positions.
A third indication appears when structure begins to fracture. An uptrend losing its higher-low sequence or a downtrend failing to maintain lower highs is a shift in narrative. A single break is not confirmation, but when it aligns with slowing impulses and liquidity failures, momentum is clearly changing.
Volatility then begins to compress. Candle ranges shrink, movement becomes less directional, and price enters a tightening pattern.
This compression often precedes expansion in the opposite direction. When a decisive candle breaks out of this cluster, the reversal typically accelerates.
Trend exhaustion is about recognizing when the conditions that supported continuation no longer exist.
By reading momentum, liquidity, and structure together, you can anticipate shifts earlier, manage risk more effectively, and position yourself on the right side of the next move.
Gold UpdateNot sure what's up with the futures chart but GLD trades on spot price, and the breakout is a lot more clear on spot price.
RSI did hit overbought, but melt up is possible since MFI is not overbought.

Lingrid | AUDUSD Channel Top Rejection ExpectedFX:AUDUSD has reached the upper boundary of its descending channel, aligning with the weekly-high zone near 0.6540, where price has repeatedly failed to break higher. It is showing early signs of exhaustion after a clean pullback into resistance, with candles losing momentum right at the confluence of the trendline and the upper channel edge — a zone that historically triggers sell-offs. The recent recovery leg appears corrective, keeping the broader bearish trend structure intact.
If sellers defend 0.6540, price is primed for a continuation lower toward 0.6484. The pattern remains bearish as long as price stays below trendline resistance and fails to establish new higher highs.
➡️ Primary scenario: rejection from 0.6540 → decline toward 0.6484.
⚠️ Risk scenario: a breakout above channel would shift momentum into a bullish corrective phase.
If this idea resonates with you or you have your own opinion, traders, hit the comments. I’m excited to read your thoughts!

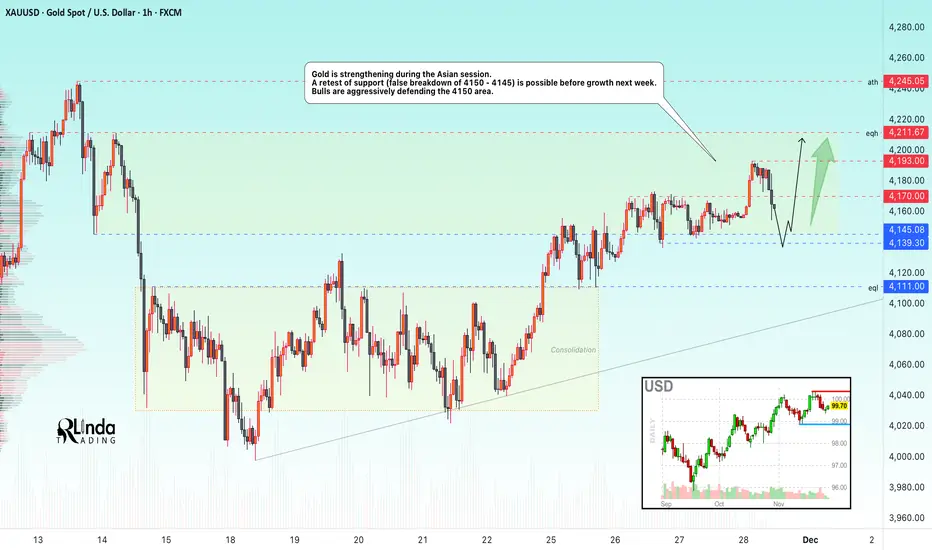
GOLD → Consolidation above 4150 amid a bullish market FX:XAUUSD breaks through 4170 and renews its high to 4193 during the Asian trading session. But further on, the market may consolidate before a possible continuation of growth...
The probability of a Fed rate cut in December remains at 82%. Geopolitical risks (Russia-Ukraine) continue to support demand for safe-haven assets. Weekly growth continues, but consolidation above $4170-4190 is required for the movement to continue.
However, low liquidity is expected on Thursday/Friday due to the holidays in the US. There may not be any strong movement, but volatility could be high during the European/American session...
Focus on the current trading range of 4150-4193...
Resistance levels: 4170, 4193, 4211
Support levels: 4150, 4145, 4139
The market is bullish both globally and locally. Accordingly, within the current trading range, gold may form a long squeeze relative to support and the liquidity zone at 4150. If the fundamental background does not change over the weekend, growth may continue next week...
Best regards, R. Linda!
BITCOIN → Retest of the 94,000 zone of interest...BINANCE:BTCUSDT.P is rebounding from its interim low of 80,000. However, it is still too early to talk about a bull market, as a countertrend correction is forming under the current circumstances.
Globally, Bitcoin is in a downtrend, with the zone of interest for a countertrend correction being 94,000-95,000. The market structure is bearish, and a retest of the break-even zone could trigger a downward movement within the trend.
After a strong liquidation to 80K, the market is forming a pullback, which is a basic phenomenon. There is no confirmation of a trend reversal yet, and the fundamental background is neutral, without clear support. Various analytical services suggest that the market is in a cleansing phase and has so far only liquidated short-term traders, reaching a cumulative average break-even price. A classic pullback. Technically, the zone of interest or magnet for the medium-term market is 75K (on the daily timeframe).
Resistance levels: 93,000, 94,000, 97,300
Support levels: 89,000, 86,000
In the current situation: a bearish trend, weak purchasing power, and a weak fundamental background, I consider a pullback to be the primary reaction to the 93-94K zone. However, the market is not constant, and if support appears (news or other drivers) and Bitcoin manages to stay above 95K, then growth can be expected.
Sincerely, R. Linda!

Bitcoin retracing SELL NOWthis is the safest way to enter a bitcvoin postion for the next couple of days , as we see seller doesn't want the price to push higher ; so it's going to reverse the movement for more liquidity or less market cap as money if running out of bitcoin

BTC - Bulls Watching the Channel Support!📈Bitcoin remains overall bullish, trading cleanly inside its rising channel. Each dip toward the lower bound has acted as a strong springboard for the next impulsive move, showing clear demand from buyers.
⚔️As BTC approaches the lower trendline of the channel and the green demand zone, we will be looking for trend-following longs. This confluence area has held multiple times and continues to act as a key decision point for market structure.
🏹As long as BTC remains above this zone , the bullish scenario remains intact, and another push toward higher highs becomes the most likely outcome. Only a break below the demand zone would weaken the bullish outlook.
Now it’s all about the retest… will the bulls defend structure once again? 🤔
⚠️ Disclaimer: This is not financial advice. Always do your own research and manage risk properly.
📚 Stick to your trading plan regarding entries, risk, and management.
Good luck! 🍀
All Strategies Are Good; If Managed Properly!
~Richard Nasr
